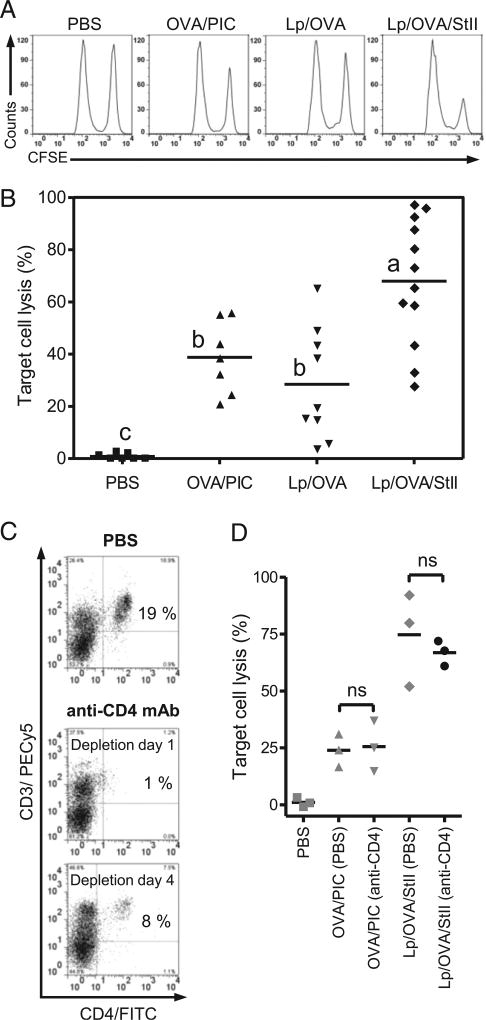
FIGURE 4.
Inclusion of StII into DPPC:Cho Lp containing OVA enhances OVA-specific cytotoxic response in mice. C57BL/6 mice (n = 3) were immunized s.c. twice at days 0 and 12 with Lp/OVA (50 µg OVA) or Lp/OVA/StII (50 µg OVA and 6.25 µg StII). PBS and 1 mg of OVA mixed with 100 µg PIC (OVA/PIC) were injected into mice as negative and positive controls, respectively. Eight days after the second immunization, mice received 60 × 106 cells containing a 1:1 proportion of target cells (SIINFEKL-charged and CFSEbright-labeled splenocytes) and control cells (without peptide and CFSEdull-labeled splenocytes) i.v., and mice were sacrificed 16–18 h later. Inguinal draining LNs were harvested, and the total events corresponding to both fluorescent intensities (CFSEdull and CFSEbright) were determined by FACS. The percentage of specific lysis was calculated as 100 (CFSEbright/CFSEdull)vaccinated × 100 × (CFSEdull/CFSEbright)PBS. (A) Line graphs of CFSEdull and CFSEbright cells from an individual mouse representative of each experimental group. (B) Percentages of target cell lysis in individual animals from multiple in vivo CTL assays; the average value is represented by a horizontal line. Different letters indicate significant differences among groups based on the Dunnett T3 test (p values are specified in the Results). In other similar CTL assays, mice immunized with Lp/OVA/StII and OVA/PIC were injected i.p. with an anti-CD4 mAb or PBS as control, at 4-d intervals, starting at day −1. (C) Dot plot graphs of CD4 versus CD3 of splenocytes from individual mice receiving anti-CD4 mAb or PBS at days 1 and 4 after treatment. Quadrants were individually set at positions where unstained cells signals were <1%. Values correspond to the percentage of cells in relation to the total lymphocytes in spleens. (D) Each data point represents cytotoxic activity in individual experimental mice. (anti-CD4) and (PBS) indicate animal groups receiving anti-CD4 mAb or PBS, respectively. Statistical significance was calculated using a two-tailed unpaired t test. The figure shows one representative experiment from three repetitions with similar results. ns, not significant, p > 0.05.

