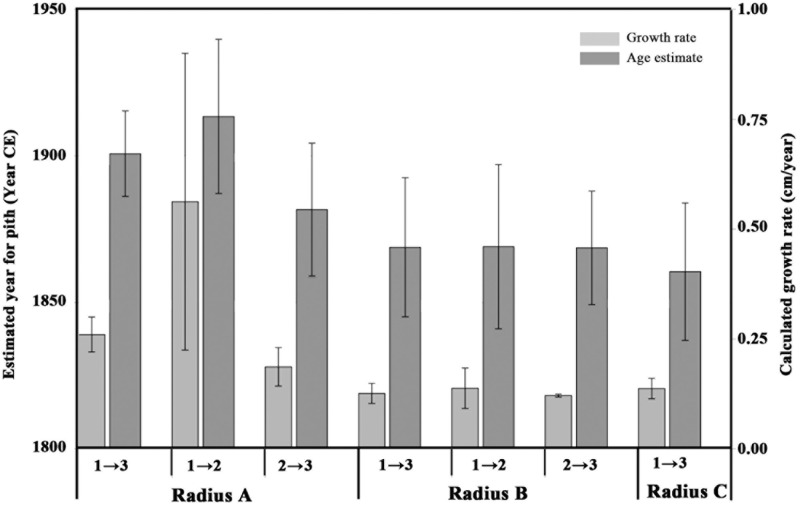
FIGURE 3.
Estimated pith age according to different points and different radii. Light gray bars indicate growth rate (cm per year, axis to the right) calculated between different points on various radii, numbered as in Figure 2: point 1 refers to the sampling point closest to the pith; point 3 refers to the sampling point closest to the bark; point 2 is the middle sampling point. Dark gray bars represent estimated ranges for the pith age (years, axis to the left), calculated according to the corresponding growth rate values. The error bars on the light gray bars (growth rate) represent the range between the minimum and maximum growth rate as explained in Table 2. The error bars on the dark gray bars (age estimate) represent the range between the minimum and maximum pith age based on the growth rate ranges.

