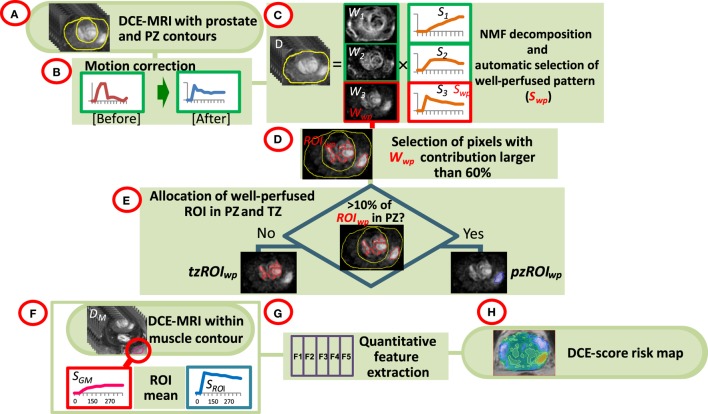
Figure 1.
Workflow of quantitative DCE-MRI analysis. (A) The input consists of DCE-MRI and contours of the prostate, peripheral zone (PZ), and a sample of gluteus maximum (GM); (B) Motion correction of the prostate; (C) Non negative matrix factorization (NMF). The data are presented as a product of three temporal patterns (S1, S2, S3) and their magnitudes (W1, W2, W3). The well perfused pattern Swp is identified between the three patterns as the pattern with the largest AUC for the first 90 s; its corresponding weights Wwp represent an intensity map of the distribution of the well-perfused pixels in the data; (D) Wwp is segmented to identify the suspected for tumor region of interest ROIwp; (E) ROIwp is assigned to PZ if >10% of ROIwp is within the PZ contour and vice versa; (F,G) Series of quantitative features (DCE-score) are computed using the signal-vs-time SROI from ROIwp and SGM of GM; (H) A spatial map of tumor aggressiveness is computed using DCE-score and Wwp.

