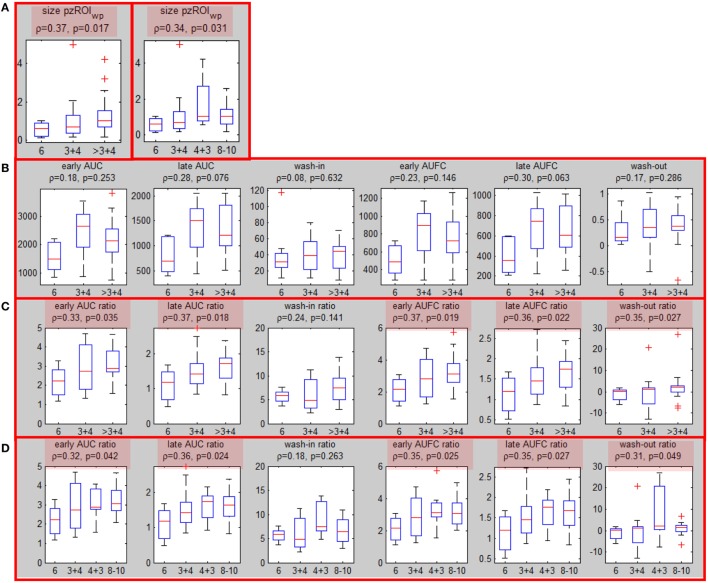
Figure 2.
Associations of well-perfused region of interest (ROIwp) volume and quantitative DCE features with Gleason Score. (A) Associations (Spearman correlation coefficient and p-values) between peripheral zone ROIwp and GS divided in 3 (left) and 4 (right) groups; (B) association of the six quantitative DCE features, calculated from the signal-vs-time curve SROI of pzROIwp and GS; (C) The same as in (B) but after normalization with the signal-vs-time from the muscle reference; significant correlations are highlighted in red. (D) The same as in (C), but four groups for GS were considered.

