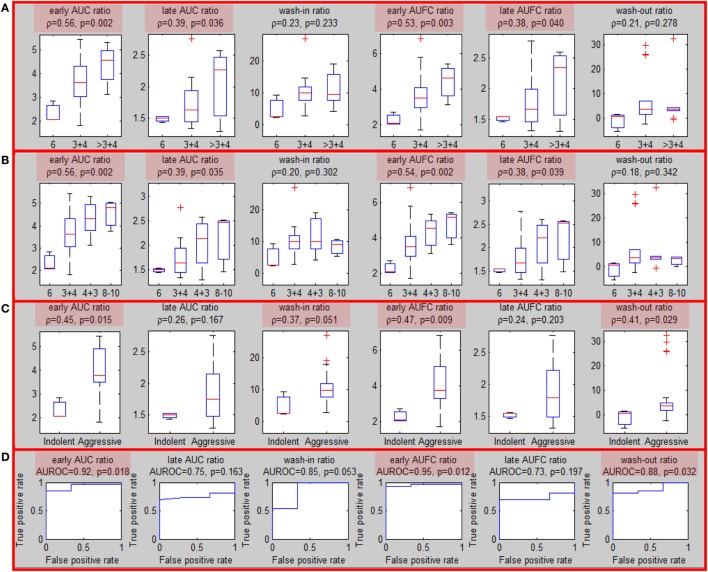
Figure 3.
Association of quantitative DCE features and Gleason Score for MRI-US biopsies. (A–C) Associations of quantitative DCE features in MRI-US well-perfused ROI (usROIwp) with GS, separated in three, four, and two groups [indolent (GS = 6) vs aggressive (GS > 6)]. Significant associations are highlighted in red; (D) area under the curve for discrimination between indolent and aggressive tumors.

