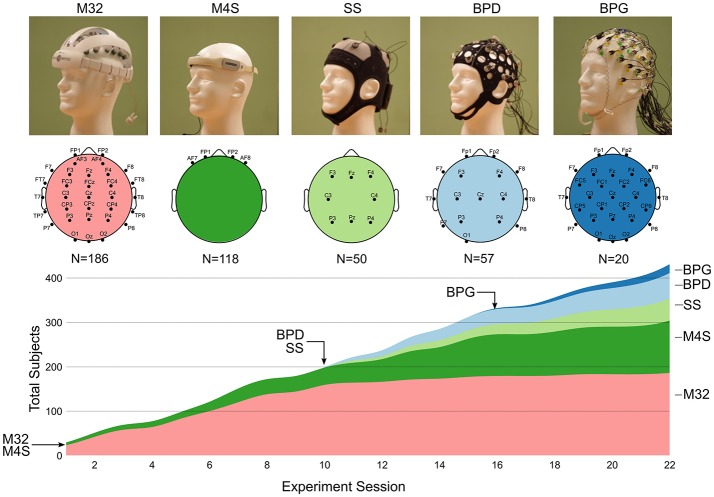
Figure 1.
Image of each EEG system and their respective electrode montage. The chart shows the cumulative usage (stacked timeline) of each system over the course of 22 consecutive weekly experimental sessions. The arrows with headset names indicate the session number in which each device was introduced into the experiment. The total number of recordings with each headset is shown under the diagram of the electrode montage for each devices (N = number of subjects).

