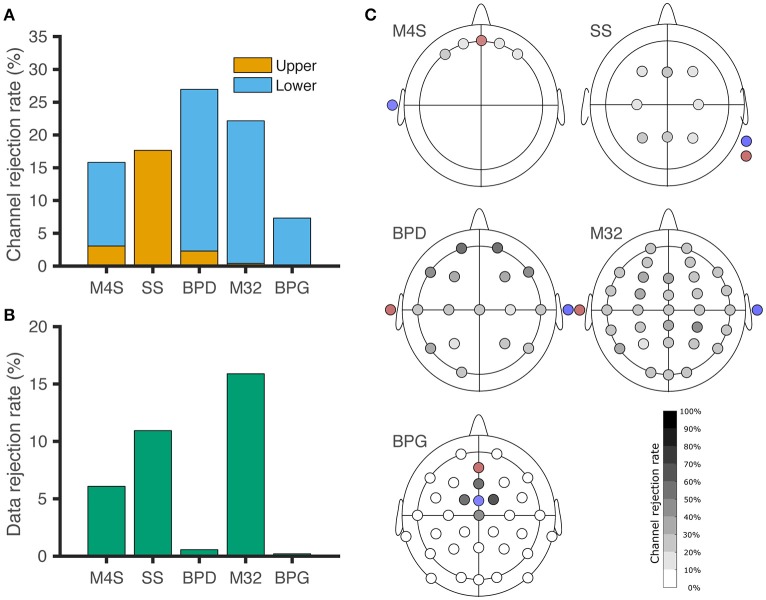
Figure 3.
Channel and data rejection statistics for all the headsets. (A) Channel rejection rate across subjects during baseline and piece-viewing. The orange bars indicate the channel rejection rate due to the channel surpassing the upper threshold for 20% of the session, while the blue bars show the rejection rate based on the channel not surpassing the lower threshold for 80% of the session. (B) Data rejection rate across subjects during baseline and piece-viewing, after artefactual channel removal. (C) EEG channel rejection rate based on the amplitude thresholding criteria. Red: Ground. Blue: Reference. For BPG, the electrodes removed around the reference correspond to lower-threshold rejections, although those channels did not exhibit digitization errors.

