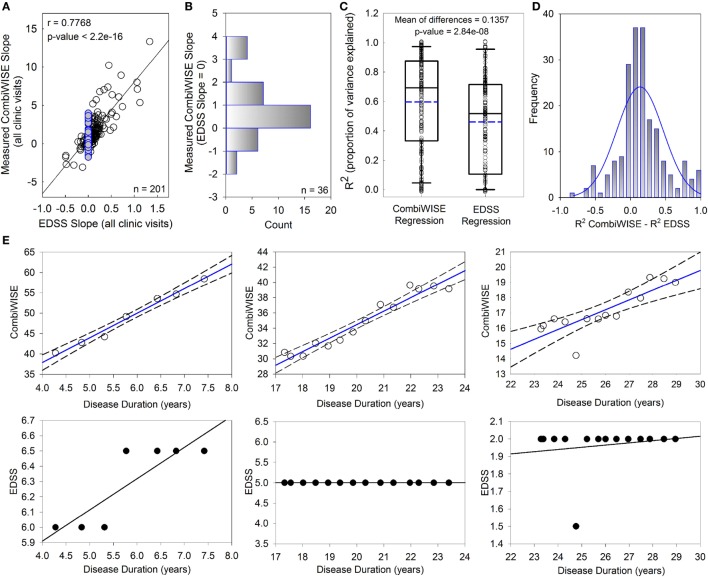
Figure 2.
CombiWISE measures multiple sclerosis (MS) progression more accurately than Expanded Disability Status Scale (EDSS). (A) Patient-specific progression rates measured by EDSS and CombiWISE regression slopes strongly correlate. (B) Frequency distribution of measured CombiWISE slopes for patients with no reported change in EDSS [highlighted blue points in (A)]. The histogram demonstrates the insensitivity of EDSS; patients can progress as much as 4 CombiWISE units/year (or improve by up to 2 CombiWISE units/year) with no change in EDSS. (C) Boxplots depict the proportion of variance explained for CombiWISE versus EDSS regressions. The median is indicated with a solid black line, and the mean is indicated with a dashed blue line. The bottom and top of the box denotes the first and third quartiles, respectively. The whiskers indicate the 10th and 90th percentiles. A two-tailed paired t-test indicated strong evidence of a mean difference of 0.1357 (95% CI, 0.089–0.182) in R2 values between the CombiWISE and EDSS regressions. (D) Histogram of difference in R2 values between CombiWISE and EDSS regressions suggests that the values are relatively normally distributed. (E) Representative patient examples illustrate higher accuracy of linear regressions (solid blue lines with dashed 95% CI; upper panels) derived from longitudinal CombiWISE measurements (no fill circles; upper panels) in comparison to linear regressions (solid black lines; lower panels) derived from longitudinal EDSS measurements (black filled circles; lower panels) from the same three MS patients.

