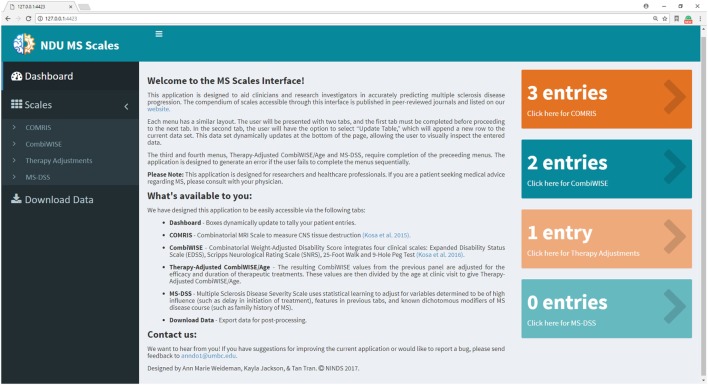
Figure 6.
Dashboard (home page) within Shiny web application. Dashboard page introduces users to the application and allows them to monitor the status of each menu by dynamically updating the number of patient entries. Users navigate between four submenus (COMRIS (11), CombiWISE (10), therapy-adjusted CombiWISE/age, and MS-DSS). Within each submenu, the user is asked to input both continuous and categorical patient-specific features using the sliding scales, free text, and drop-down options. As the user enters data within each tab, results from intermediate computations are displayed in tabular form, enabling the user to parse through the dataset and examine output. This user-friendly interface was developed using the Shiny package in R (20).

