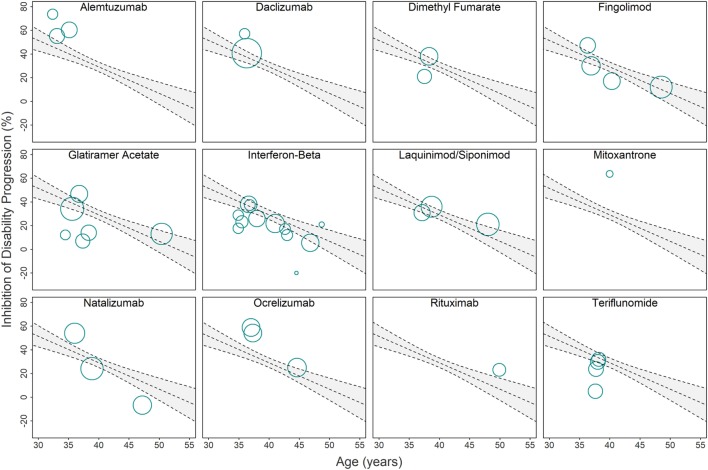
Figure 3.
Relationship between immunomodulatory drugs and original linear regression model used for computing drug-specific weighted residuals. Due to the overlap of clinical trials in the Figure 2 (bottom panel) linear regression model, we provide a separate visual representation of all clinical trials that studied individual drugs or drug classes. Each circle corresponds to a single clinical trial with area proportional to the number of subjects and trial duration . The gray area depicts 95% confidence interval estimates. Trials with circle center above the regression line have better-than-average efficacy adjusted for age, while trials with circle center below the regression line have worse-than-average efficacy adjusted for age. The distances from the circle center to the regression line (i.e., residuals) are adjusted by weight and SD (see Eq. 8 in Materials and Methods) and then averaged to compute the drug-specific weighted residuals (Figures 4A,B).

