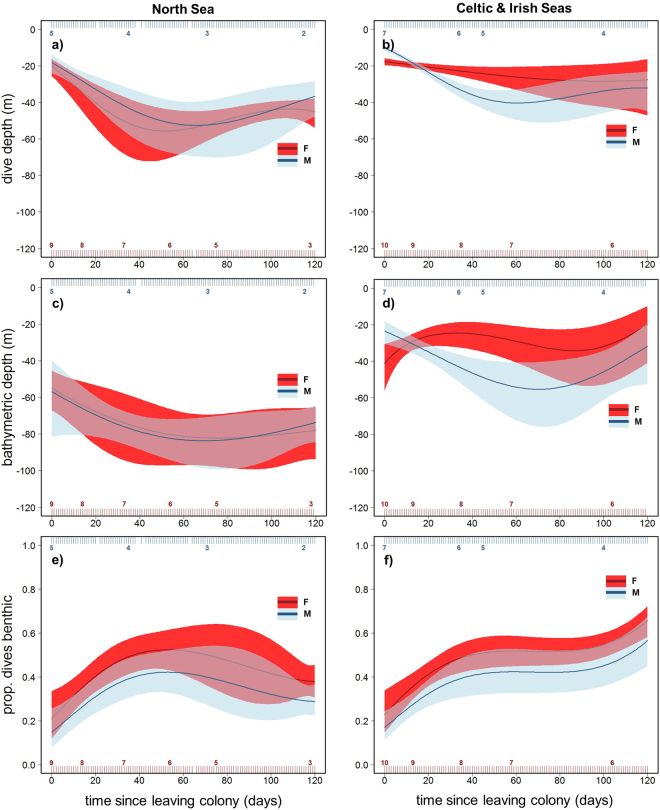
Figure 5.
Sex and region differences in ontogeny of dive depth. Model-fitted values for daily mean maximum dive depth (a,b) and bathymetric depth of dive locations (c,d) over time since leaving the colony. Solid lines show population mean responses by region (North Sea (NS) left, Celtic and Irish Seas (CIS) right), with associated GEE-based 95% confidence intervals (shaded areas). Pups increased their dive depth rapidly over the initial 40 days (a,b), except for CIS females (b). NS pups dived in deeper water throughout (c). Sex differences in bathymetric depth of dive locations emerged from the outset in CIS pups, as females (red) dived in shallower areas (d). The proportion of dives that were benthic increased rapidly for all pups over the initial 40 days. However, females recorded marginally higher mean values than males in both regions (e,f). Rug plots top and bottom show the distribution of data, colour-coded by sex, and associated numbers indicate pup sample size.

