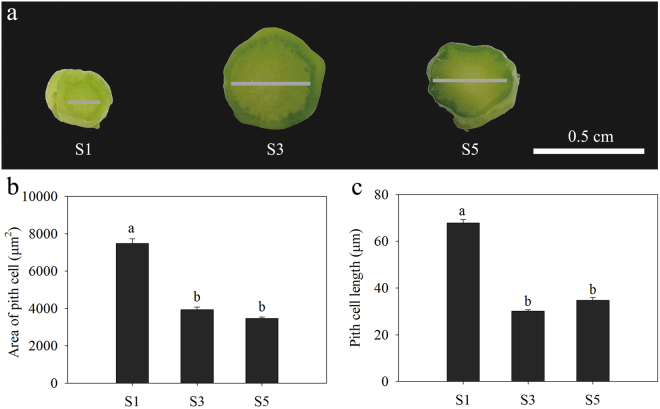
Figure 2.
Analysis of stalk anatomy at three stalk development stages (S1, S3, and S5) of flowering Chinese cabbage. (a) Transverse sections of shoot tips at the different developmental stages; grey lines denote the pith region. (b) Area of pith cells in transverse sections at each developmental stage. (c) Pith cell lengths in longitudinal sections at each developmental stage. Values with different letters indicate significant differences at P < 0.05 according to Duncan’s multiple-range tests. Error bars indicate standard errors.

