Figure 6.
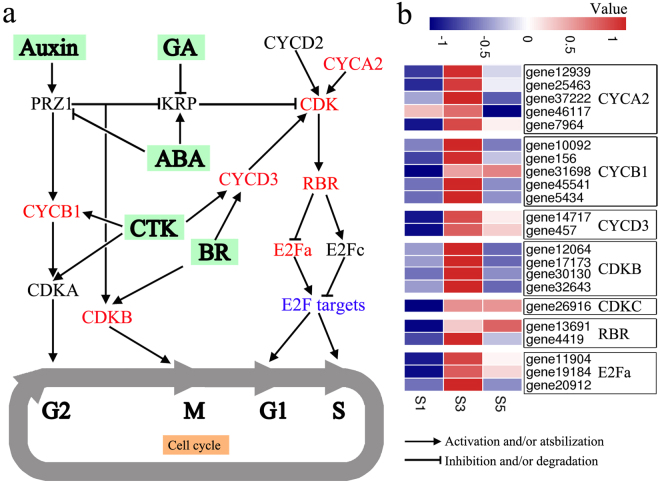
Signalling pathways related to cell cycle regulation. (a) Schematic representation of the cell cycle-regulation network. The expression of genes indicated in red were significantly different among the three stages of stalk development. Genes in black were not significantly different among the three stages of stalk development. Arrows represent the promotion of gene activation, and blunted lines represent gene repression. (b) Heat map of the DEGs associated with cell cycle regulation. Red and blue colours represent up- and down-regulation, respectively. The values represent the Z-scores for the FPKM data.

