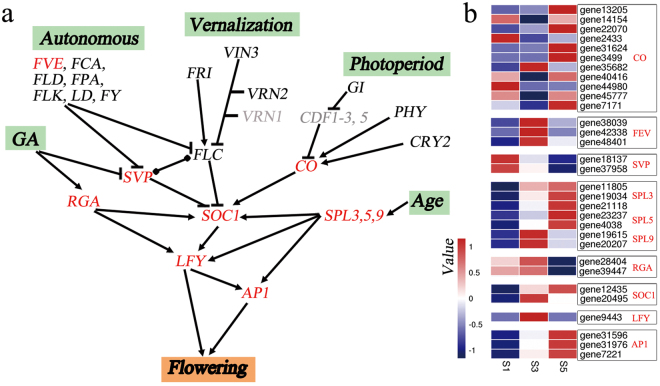
Figure 7.
Signalling pathways related to the flowering time. (a) Simplified regulatory network of flowering time-related genes in the shoot apex. The expression levels of genes indicated in red were significantly different during the three stages of stalk development. The expression of genes in black were not significantly different during the three stages of stalk development. No significant differences in genes in grey were observed during the three stages of stalk development. Arrows represent the promotion of gene activation, blunted lines represent gene repression, and round dots at both ends mark an interaction without a known direction. (b) Heat map of genes that were differentially expressed during the three stalk development stages (S1, S3, and S5). Red and blue colours represent up- and down-regulation, respectively. The values represent the Z-scores of the FPKM data.

