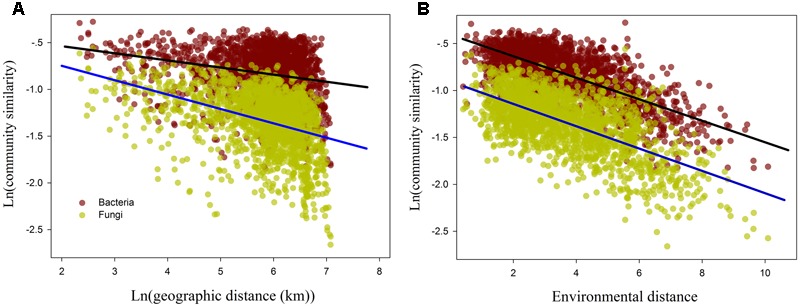
FIGURE 4.

The relationship between the bacterial and fungal β-diversity and ln geographic distance (A) and environmental distance (B). The regression line of (A) denotes distance-decay curves for the bacterial (black line) and fungal (blue line) communities.
