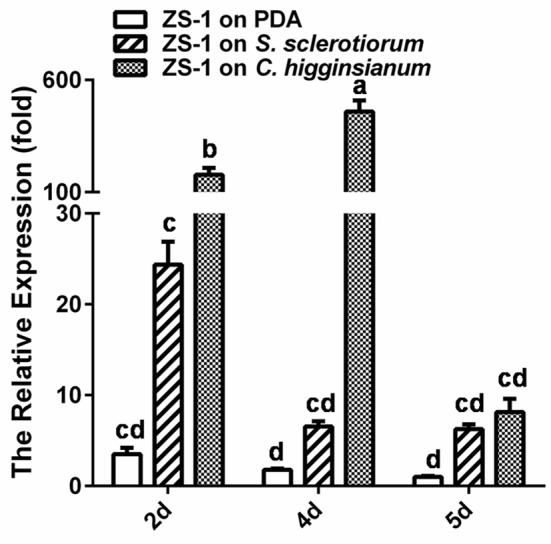
Figure 8.

Inducible expression of CmSIT1 in C. miniatns when contacting with its host, S. sclerotiorum and non-host fungus, C. higginsianum 2, 4, and 5 dpi. The relative levels of transcript were calculated by the comparative Ct method. The levels of actin transcript were used to normalize different samples. The relative expression level of CmSIT1 in the wide-type stain ZS-1 for 5 d was assigned as value 1. Bars represent means and standard deviations (three replications). Error bars indicate the SD from four replicate means. Means followed by the different letters on the top of each column are significantly different at the P < 0.05 level of confidence according to Duncan's multiple range test.
