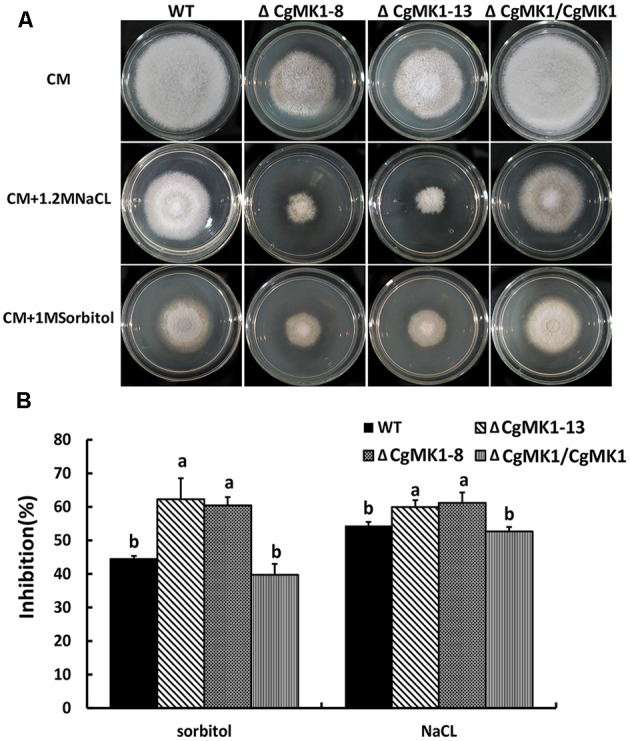
FIGURE 8.

CgMK1 in response to osmotic stresses. (A) Colony morphology of the wild-type strain, ΔCgMK1 mutants (ΔCgMK1-8, ΔCgMK1-13) and complemented strain after 3 days of growth on CM or CM containing 1 M Sorbitol, 1.2 M NaCl. (B) The bar chart showed the colony diameter of wild-type, mutants and complementation strain under different chemical stresses. Data sets were calculated from the picture (A). “a” and “b” indicate a significant difference between wild-type, mutant and complementation strain at P = 0.05 according to Duncan’s range test.
