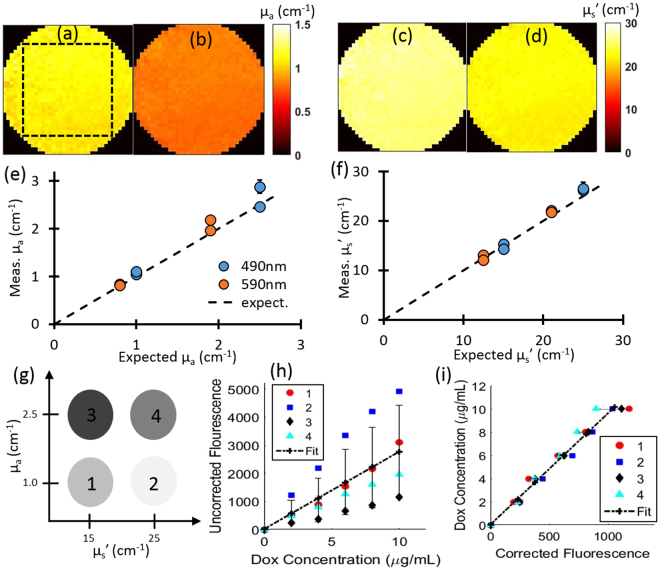
Figure 1.
System calibration and optical property correction. (a) and (b) show absorption maps of one calibration phantom at 490 nm and 590 nm respectively. The dashed square indicates the ROI. (c) and (d) show scattering maps of the same calibration phantom at 490 nm and 590 nm respectively. (e) and (f) show the quantification of absorption and scattering all four calibration phantoms respectively. (g) A schematic of the acquired phantom optical properties. (h) Uncorrected (raw) Dox fluorescence vs. Dox concentration, showing the large variation with respect to background optical property differences. (i) Attenuation-corrected Dox fluorescence vs. Dox concentration using all phantoms at different absorption and scattering parameters, indicating a strong linear relationship with respect to Dox concentration. Error bars represent standard deviation between phantoms.

