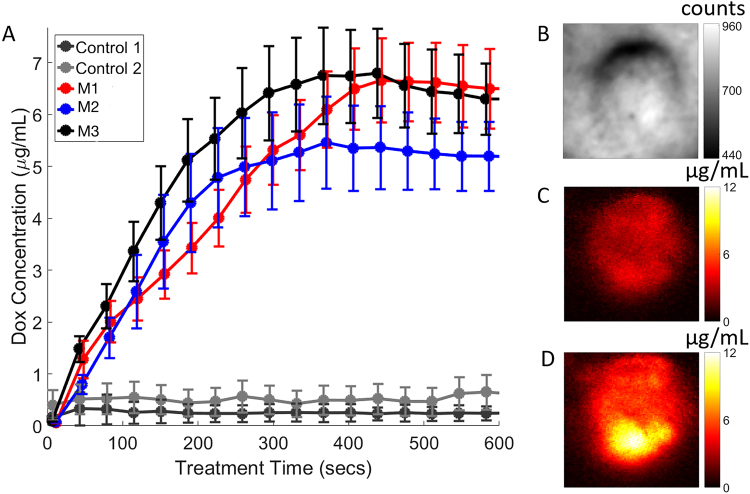
Figure 6.
Quantified drug release in mice. (A) In vivo release kinetics curves with respect to irradiated light treatment time. (B) A representative white light structural image related to mouse 3 (M3), showing the Dox release in the tumor. (C) Quantified Dox fluorescence concentration map 1-minute post treatment light irradiation. (D) Quantified Dox fluorescence concentration map 10-minute post treatment light irradiation. The video, Exp 3.avi, shows the release kinetics, changes in released drug concentration with respect to treatment light irradiation for M3.

