Fig. 5.
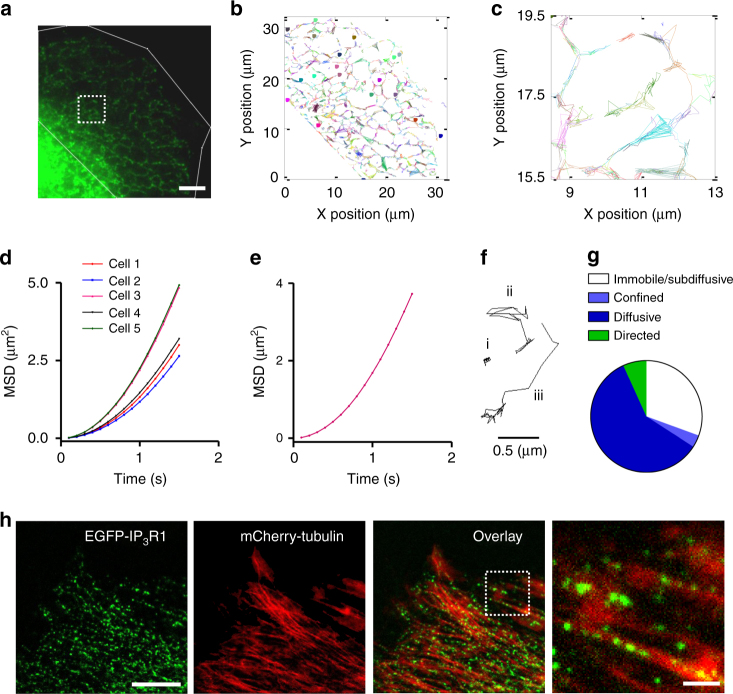
IP3Rs move by diffusion and by directed motion along microtubules. a TIRFM image used for single-particle tracking shows characteristic reticular ER. Scale bar = 5 µm. b Trajectories of all puncta from the region defined by white lines in a. Colours indicate different trajectories. c Enlargement showing trajectories within the boxed area in a. d Average mean squared displacement (MSD) for all puncta within each cell plotted against time. Results are from five cells, with 225–926 puncta analysed in each. e Pooled results from five cells (2,698 tracks). f Examples of single-particle trajectories (collected at 100-ms intervals) for an immobile punctum (i) or mobile puncta moving by diffusion (ii) or directionally (iii). g Distribution of EGFP-IP3R1 puncta between mobility states. Trajectories of 1,509 puncta from five cells were analyzed by TraJClassifier (Supplementary Fig. 10). h Wide-field images, typical of nine cells, show EGFP-IP3R1 puncta, microtubules (mCherry-tubulin) and their co-localization. Final panel shows an enlargement of the boxed area in the overlay. Scale bar = 10 µm (2 µm in enlargement)

