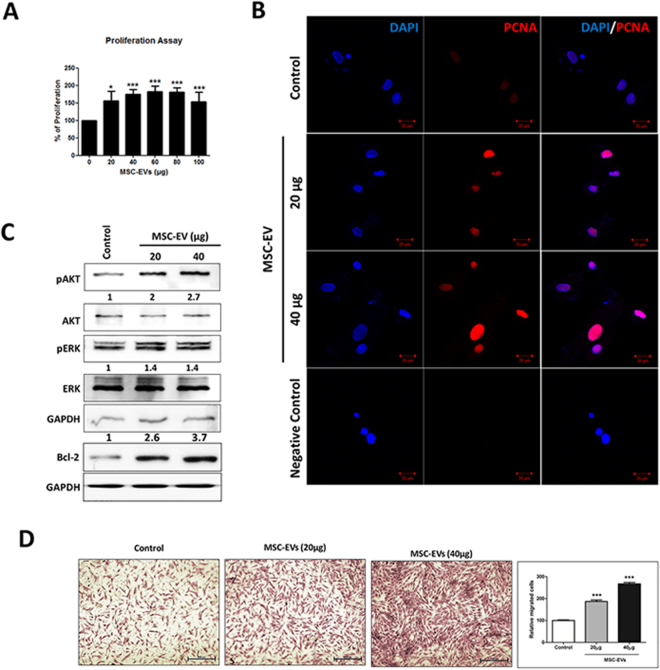
Figure 3.
Effects of MSC-EVs on DP cell proliferation and migration. (A) Histogram showing cell proliferation as determined by a CCK8 assay, 24 h after treatment with 0–100 µg MSC-EVs. The mean and SD of triplicate experiments are plotted. *p < 0.05, ***p < 0.001. (B) Fluorescent images of DP cells immunostained for PCNA 24 h after either no treatment or treatment with 20 or 40 µg MSC-EVs (scale bar, 20 μm). (C) Western blot analysis of Akt, ERK, Bcl-2 and GAPDH levels in DP cell lysates 24 h after either no treatment or treatment with 20 or 40 µg MSC-EVs. (D) Representative images of migrated cells (scale, 500 pixels) are shown, as well as a quantified bar diagram of migrated cells. The mean and SD of triplicate experiments are shown. **p < 0.01, ***p < 0.001. Student t-test was used.

