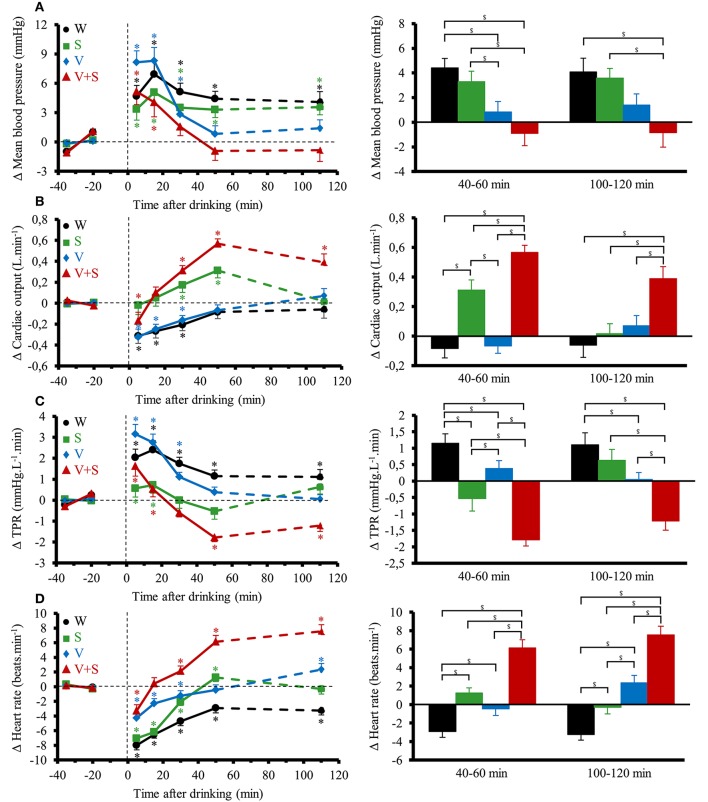
Figure 3.
(A–D) Left panel: time course of the changes in mean blood pressure (A), cardiac output (CO) (B), total peripheral resistance (TPR) (C), and heart rate (D). Right panel: mean responses averaged over 40–60 and 100–120 min relative to baseline values and presented as a delta (i.e., average over 40–60 and 100–120 min post-drink period, respectively, minus the average over the 30 min baseline period). Drinks: water (W)  ,
,  ; water + sugar (S)
  ,
,  ; water + vodka (V)
  ,
,  ; water + vodka + sugar (V+S)
  ,
,  . *p < 0.05 significant differences over time from baseline values; $p < 0.05 significant differences between responses to the drinks.

