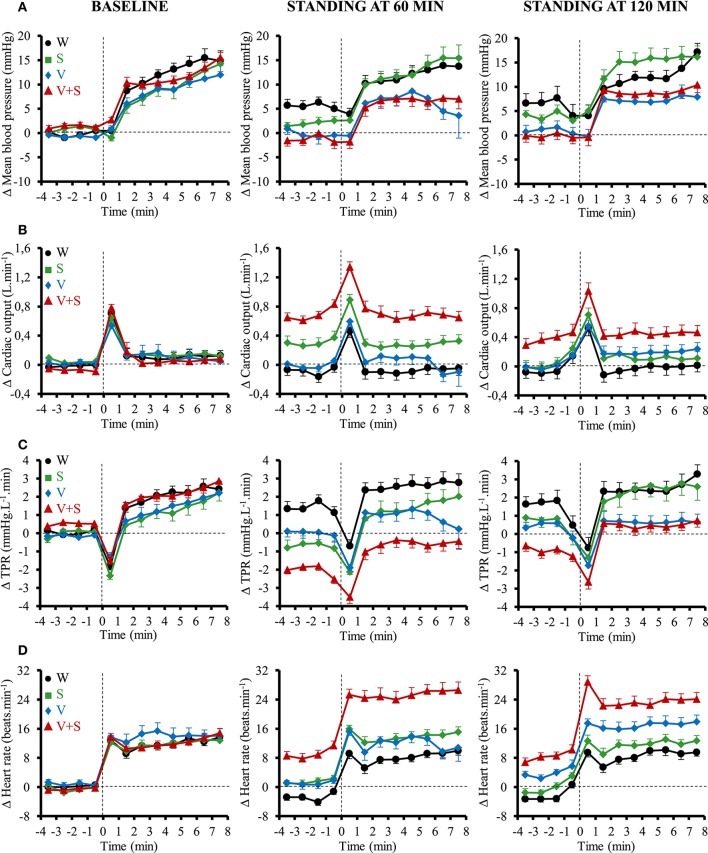
Figure 6.
Time course of the changes in mean blood pressure (A), cardiac output (CO) (B), total peripheral resistance (TPR) (C), and heart rate (D) 4 min before standing and during the first 8 min of active standing during baseline and after 60 and 120 min post-ingestion. Data are relative to baseline values prior to drink ingestion. Drinks: water (W)  ,
,  ; water + sugar (S)
  ,
,  ; water + vodka (V)
  ,
,  ; water + vodka + sugar (V+S)
  ,
,  .
.

