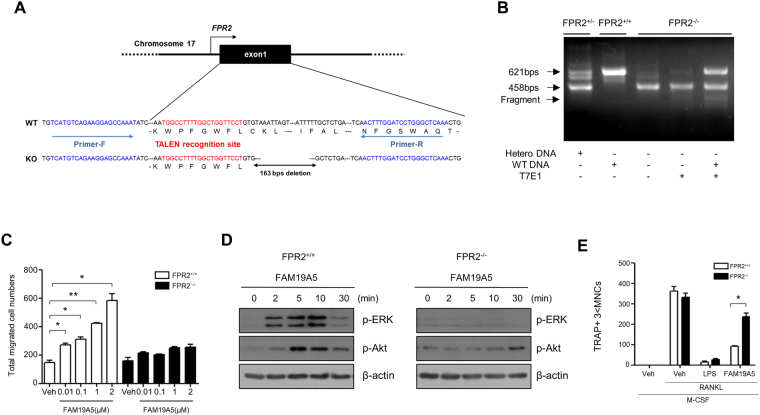
Figure 5.
FPR2-deficiency blocks FAM19A5-induced BMDM chemotaxis and FAM19A5′s inhibitory effects on osteoclastogenesis. (A) TALEN recognition site for the generation of FPR2 knockout mice. (B) T7E1 assay of WT, heterozygotes, and homozygotes of FPR2 knockout mice. (C) BMDMs generated from FPR2+/+ or FPR2−/− mice were subjected to chemotaxis assay using several concentrations (0, 0.01, 0.1, 1, and 2 μM) of FAM19A5. The number of migrated cells was determined by counting under a light microscope. (D) Mouse BMDMs generated from FPR2+/+ or FPR2−/− mice were stimulated with 2 μM of FAM19A5 for 0, 2, 5, 10, and 30 min. Total cell lysates were separated by SDS-PAGE. Levels of p-ERK and p-Akt were measured by Western blot analysis. (E) Mouse BMDMs were stimulated with FAM19A5 (2 μM) in the presence of M-CSF (30 ng/ml) and RANKL (100 ng/ml) for 4 days. All cells were stained with TRAP staining solution. The number of cells with TRAP+ 3 < MNCs was counted. Data in these panels are representative of three independent experiments (D). Data are presented as means ± SE (n = 3). Data are representative of three independent experiments (C,E). *p < 0.05; **p < 0.01.

