Fig. 3.
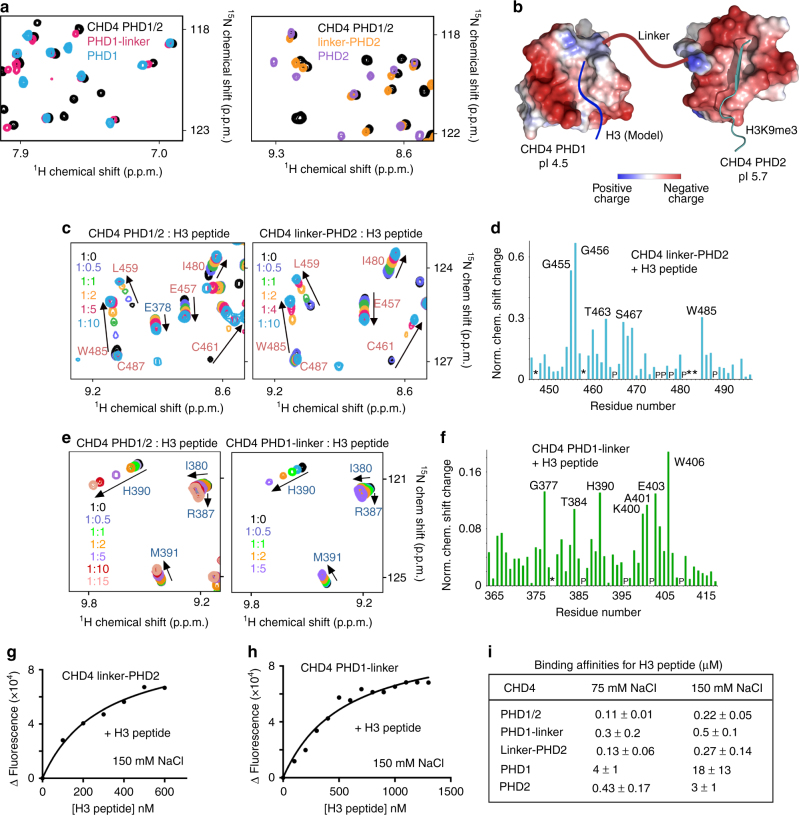
The linker affects histone binding of PHDs. a Superimposed 1H,15N HSQC spectra of CHD4 PHD1, PHD1-linker, and PHD1/2 (left) or CHD4 PHD2, linker-PHD2, and PHD1/2 (right). b The inter-domain organization of CHD4 PHD1/2. Electrostatic surface potential of PHD1 and PHD2 in complex with H3K9me3 peptide (PDB IDs: 2L5U and 2L75). Blue and red colors represent positive and negative charges, respectively. c Superimposed 1H,15N HSQC spectra of PHD1/2 or linker-PHD2 collected upon titration with histone H3 (1–12) peptide. d The histogram shows normalized 1H,15N chemical shift changes induced by the peptide in linker-PHD2. e Superimposed 1H,15N HSQC spectra of either PHD1/2 or PHD1-linker collected upon titration with histone H3 (1–12) peptide. f The histogram shows normalized 1H,15N chemical shift changes in backbone amides of the PHD1-linker due to binding to H3 peptide. g, h Representative binding curves used to determine the K d values for CHD4 linker-PHD2 and PHD1-linker by tryptophan fluorescence. Three (PHD1-linker) or four (linker-PHD2) separate runs were performed to obtain SD. i Binding affinities of CHD4 PHDs to H3 (1–12) peptide as measured by fluorescence spectroscopy in buffer containing 75 mM NaCl or 150 mM NaCl. Error is SD based on three or four separate experiments

