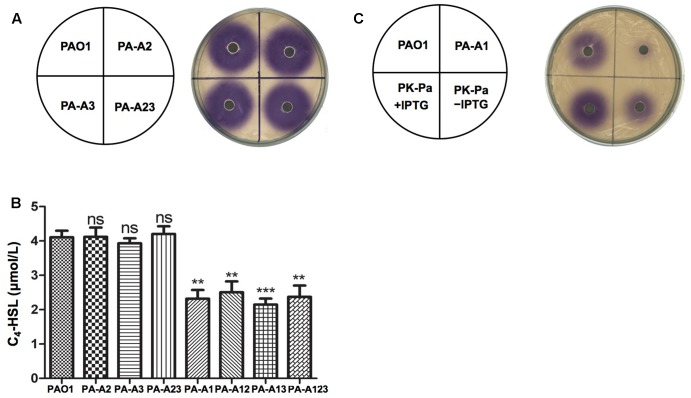
FIGURE 2.
Detection of C4-HSL signals produced by P. aeruginosa mutant strains. (A) Analysis of the C4-HSL signals produced by P. aeruginosa acpP2 and acpP3 mutant strains using Chromobacterium violaceum reporter strain CV026. (B) Quantitative analysis of the C4-HSL signal produced by P. aeruginosa acpPs mutant strains using high performance liquid chromatography (HPLC). (C) Analysis of the C4-HSL signals produced by P. aeruginosa acpP1 mutant strains using C. violaceum reporter strain CV026. The acylated HSL fraction was extracted from the supernatants of stationary-phase cultures grown in LB broth at 37°C for 12 h. PAO1, P. aeruginosa wild type strain; PA-A2, P. aeruginosa acpP2::Gmr single mutant strain; PA-A3, P. aeruginosa acpP3::Gmr single mutant strain; PA-A23, P. aeruginosa acp2::Tcr acp3::Gmr double mutant strain; PA-A1, P. aeruginosa acp1::Ec acpP single mutant strain; PA-A12, P. aeruginosa acp1::Ec acpP acp2::Gmr double mutant strain; PA-A13, P. aeruginosa acp1::Ec acpP acp3::Gmr double mutant strain; PA-A123, P. aeruginosa acp1::Ec acpP acp2::Tcr acp3::Gmr triple mutant strain; PK-Pa, P. aeruginosa acp1::Ec acpP single mutant strain carrying plasmid, pSRKPa, encoding wild type P. aeruginosa acpP1 gene. Data are the mean ± standard deviation of triplicate measurements. Pair-wise comparisons were made between wild-type strain PAO1 and each mutant strain by Student’s t-test. ∗∗∗Highly significant difference, P < 0.01. ∗∗Significant difference, P < 0.05. ns, no significant difference, P > 0.1.

