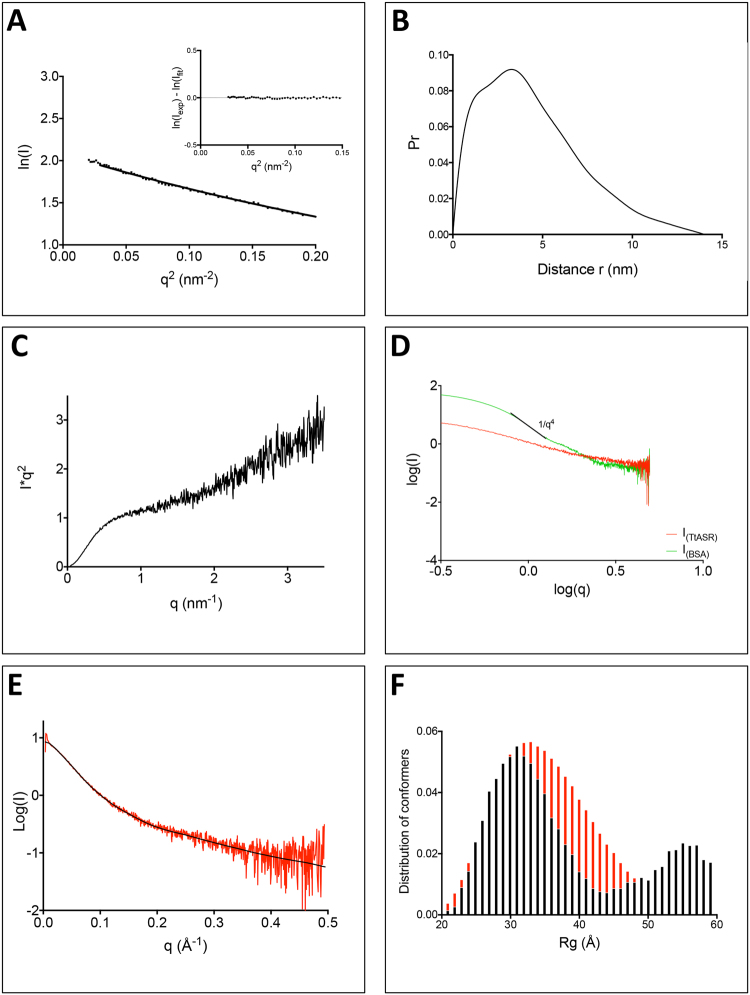
Figure 4.
SAXS studies of TtASR1. (A) Representation of the Guinier plot for the protein at 3.0 g/L. Inset: residuals. (B) Pair distance distribution, P(r), function of the data for the 3.0 g/L concentration. (C) Kratky plot of the SAXS data obtained at 1.5 g/L. (D) Log-log representation of TtASR1 and BSA SAXS patterns. (E) Experimental scattering curve of the protein at 3.0 g/L (red) and GAJOE fit (black). (F) Distribution of Rg of the ensemble of randomly generated conformers by Flexible-Meccano without constraints (red) and of the sub-ensemble of selected conformers using GAJOE (black).

