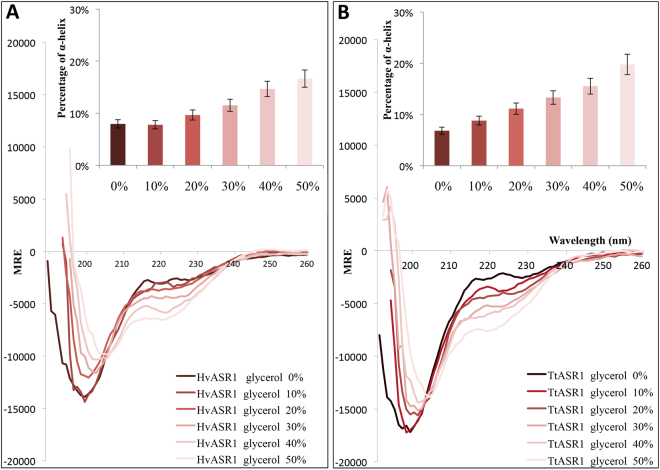
Figure 6.
Far-UV CD spectra of HvASR1 (A) and TtASR1 (B) in the presence of increasing concentrations of glycerol at 20 °C. Proteins were at 0.1 mg/mL in 10 mM sodium phosphate pH 7. Data are shown to the point up to which the dyna voltage was in the permissible range. Data are representative of one out of two independent acquisitions. The insets show the α-helical content as derived as described in Methods (see Eq. 14). MRE: molar residue ellipticity.

