
Fig. 1.
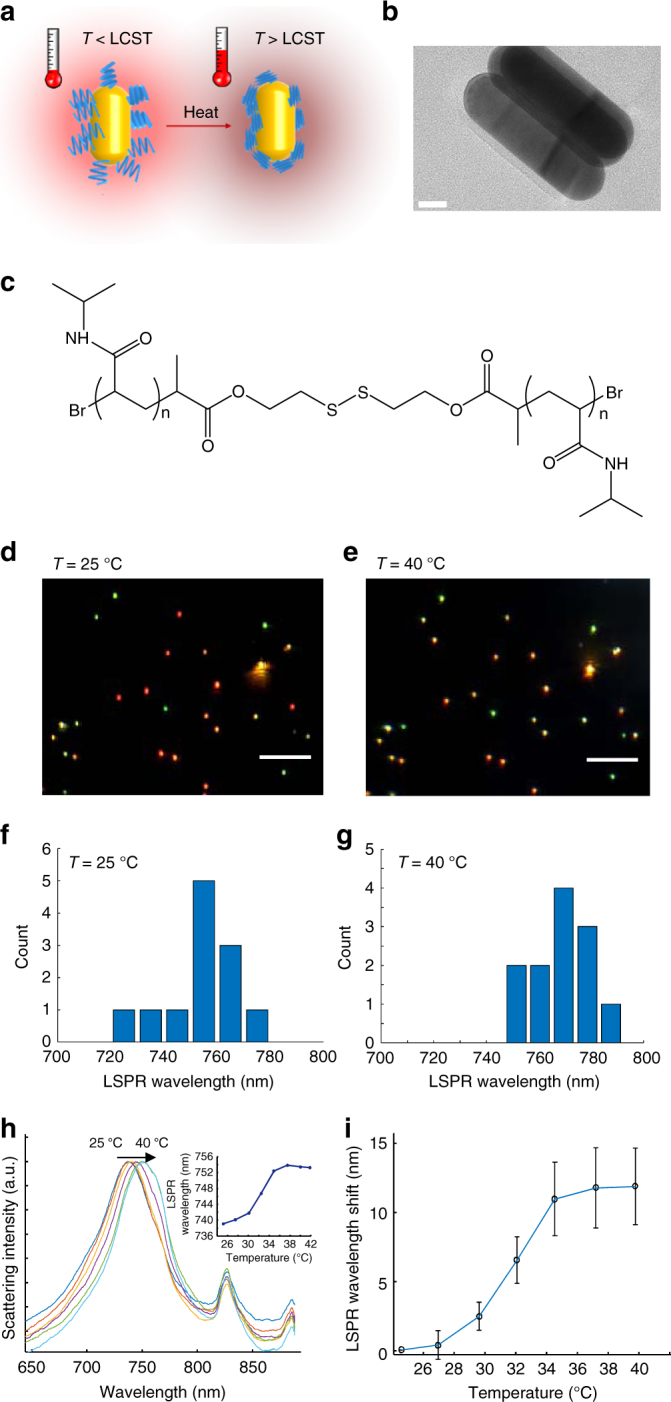
Schematic illustration of the thermometry principle of AuNR@pNIPAAm. a The temperature response mechanism of AuNR@pNIPAAm. b The high-resolution transmission electron microscopy image of AuNR@pNIPAAm. Scale bar is 20 nm. c The molecular structure of pNIPAAm for AuNR@pNIPAAm fabrication. d A broadband DFM image of AuNR@pNIPAAm at 25 °C. Scale bar is 5 μm. e Same as d but the temperature is increased to 40 °C. f The LSPR wavelength distribution of AuNR@pNIPAAm at 25 °C. g Same as f but the temperature is increased to 40 °C. h Scattering spectra of a single AuNR@pNIPAAm particle over the temperature. Inset: Temperature-dependent LSPR wavelength of this particle. i Mean scattering spectral redshifts of single AuNRs@pNIPAAm particles as functions of the temperature. Error bars, ±1 s.d. with n = 10 each