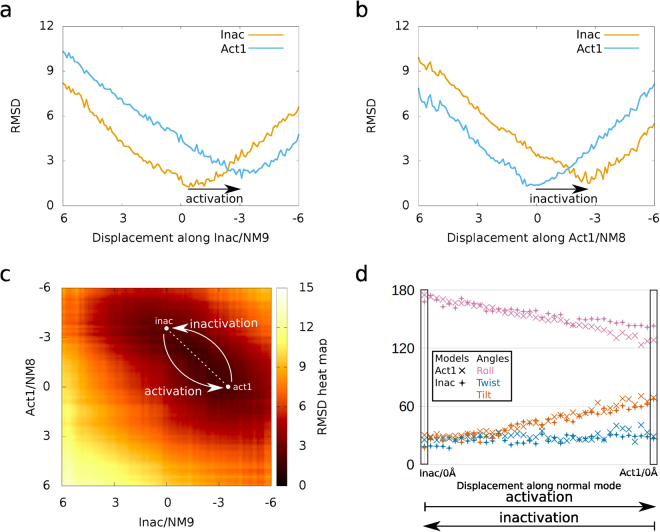
Figure 3.
Activation and inactivation descriptions using RMSD and proposed angles. In (a) inact/NM9/0 Å and -3Å structures resemble inact (orange line) and acti1 (blue line), respectively, describing the BthTX-I activation process. In (b) acti1/NM8/−3Å and 0 Å resemble inact (orange line) and acti1 (blue line), respectively, describing the BthTX-I inactivation process. In (c) the RMSD heat map demonstrates darker and lighter colours corresponding to high and low similarities, respectively. The structures from the dashed white transparent line from the white circle, which starts in act/NM8/−3.7 Å and inact/NM9/0 Å and ends in acti1/NM8/0 Å and inact/NM9/−3.7 Å, are similar and describe complementarity between activation and inactivation. In (d) the pairs of structures delimitated by the dashed white transparent line in (c) have similar angles, and activation is characterized by increase of roll, stability of twist and decrease of tilt angles. In (d) roll, twist, and tilt are coloured magenta, dark blue and vermilion, respectively, and models of acti1 and inact are represented by X and ◆, respectively.

