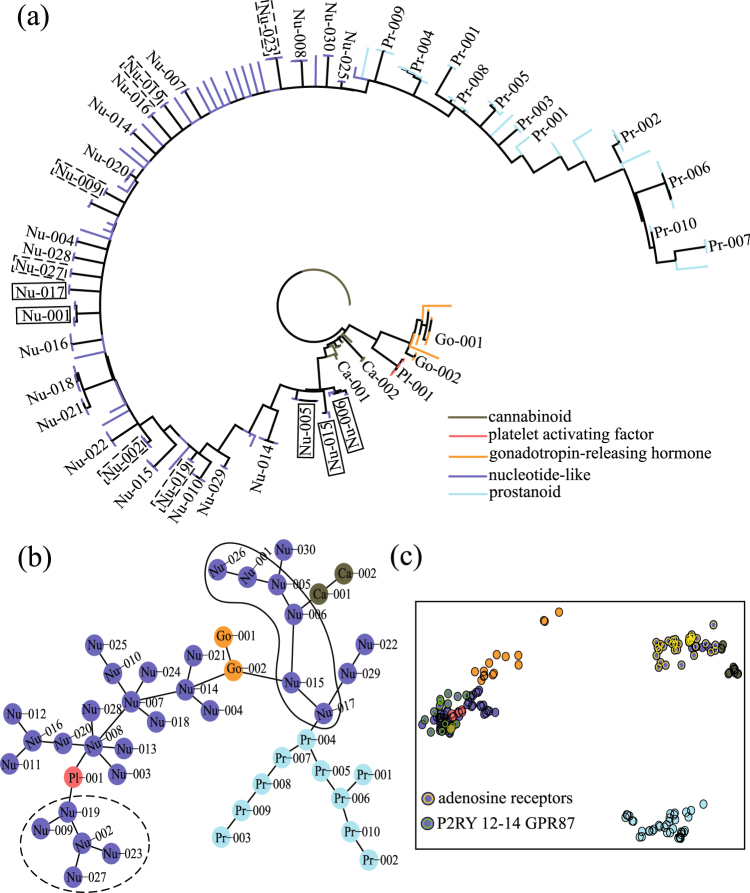
Figure 10.
Phylogenetic trees of 185 GPCR sequences using both character-based (a) and distance-based methods (b). The data points in (c) show the location of these sequences on a two-dimensional projection by MDS. The branching tree diagram in (a) was constructed using the maximum likelihood method and displayed with the polar tree layout. The minimum spanning tree diagram in (b) was displayed by viewing each level 1 MSC cluster as a node.

