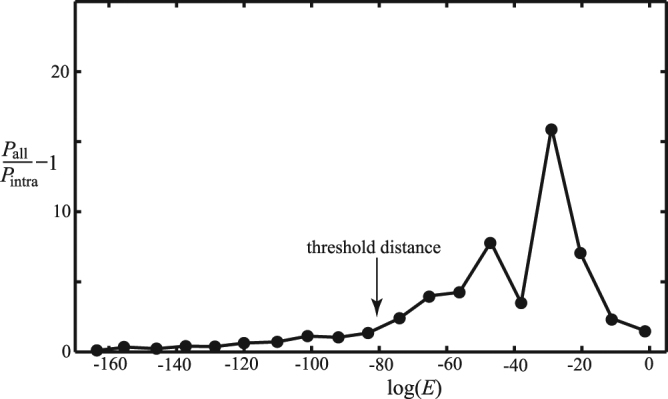
Figure 2.

The relative difference in edge length distributions of the minimum spanning tree diagram and of the first level MSC clusters in the GPCR network. The length distribution of the minimum spanning tree includes both intra- and inter-cluster edges, whilst that of MSC clusters only includes intra-cluster edges. The difference is contributed from inter-cluster edges. The threshold distance between clusters is chosen to be 10−80, where the value of P all/P intra −1 is nonzero and increases sharply.
