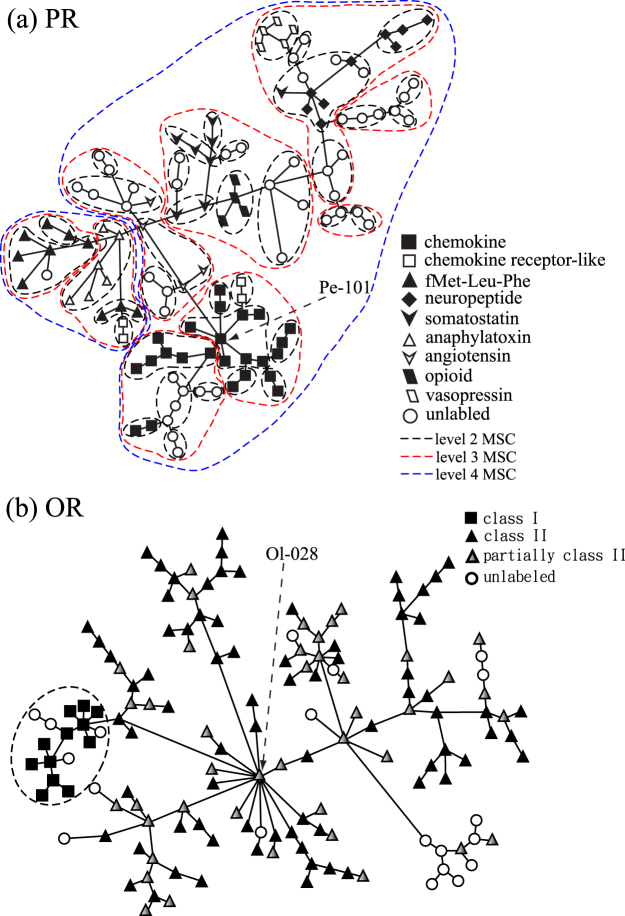
Figure 7.
The minimum spanning tree diagrams of PRs’ main group (a) and ORs (b) in the target dataset. Here each node represents a level 1 MSC cluster. In (a), the shape of nodes designates which ligand they bind. Dashed loops in black, red, or blue show the MSC clustering of PRs at level 2, level 3, or level 4, respectively. In (b), the shape of nodes labels receptor clusters belonging to class I, class II, partially class II, or others.

