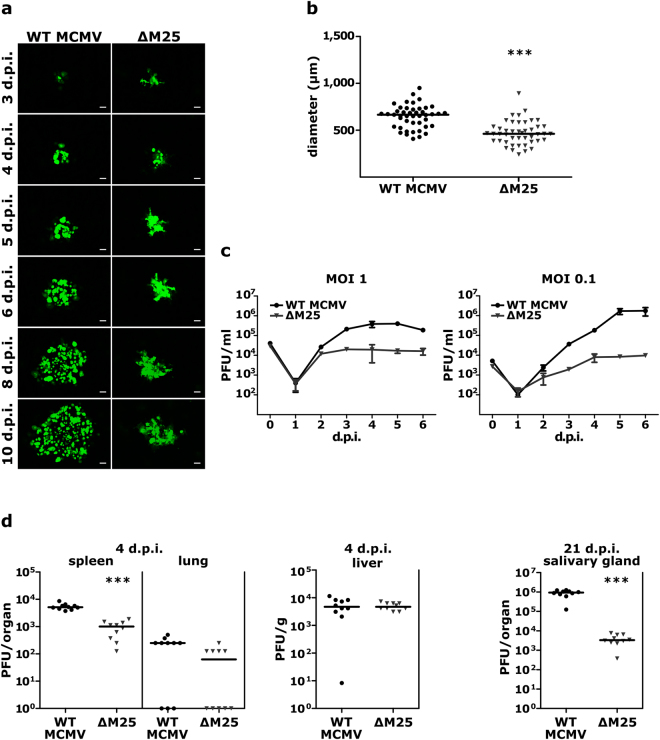
Figure 6.
Diminished cell-to-cell spread and virus yields of the ∆M25 mutant. (a) Foci formation of infected cells was monitored for 10 days by fluorescence microscopy of MEF monolayers infected with WT MCMV or the ∆M25 mutant at low MOI. Scale bars, 100 µm. (b) Areas of infected cells were measured for WT MCMV (n = 45) and the ∆M25 mutant (n = 45) on day 5 p.i. Infected cells were identified based on virus-driven GFP expression. Bars in the graphs represent medians and statistical analysis was performed by Mann-Whitney two-tailed test. ***P < 0.001. (c) MEF were infected with the indicated viruses at an MOI of 0.1 or 1. Culture supernatants were collected at indicated days after infection and titers quantified by plaque assay. Data points represent means ± SD of triplicate samples. (d) BALB/c mice were infected intraperitoneally with MCMV-GFP-ie1/3 (WT) or MCMV-GFP-ie1/3_ΔM25 (ΔM25), and virus titers in liver, spleen and lungs at day 4 p.i. and in salivary glands at day 21 p.i. were determined by plaque assay. Each dot represents the value for one animal (n = 10 for each group) and bars indicate medians. Statistical significance was calculated by Mann-Whitney two-tailed test. ***P < 0.001.

