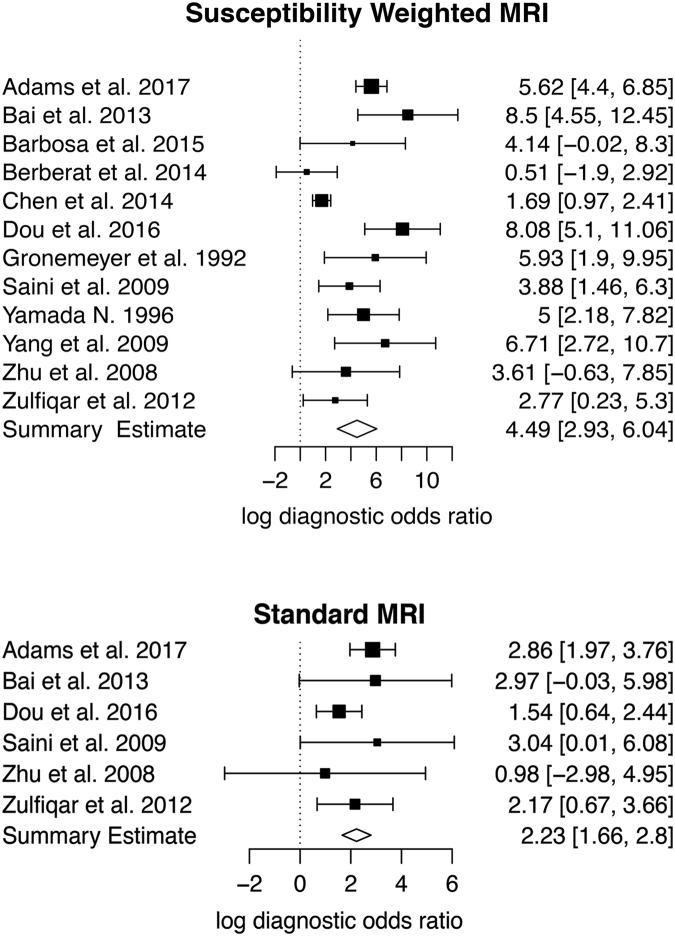
Figure 3.
Forest plots showing the log diagnostic odds ratios (black squares) for susceptibility weighted imaging and standard magnetic resonance imaging (MRI) (where available) of each study with 95% confidence intervals (horizontal lines). The area of each square is proportional to the study’s weight in the meta-analysis and the summary measure of effect is plotted below as a diamond. An effect size of zero is indicated by the vertical dashed line.

