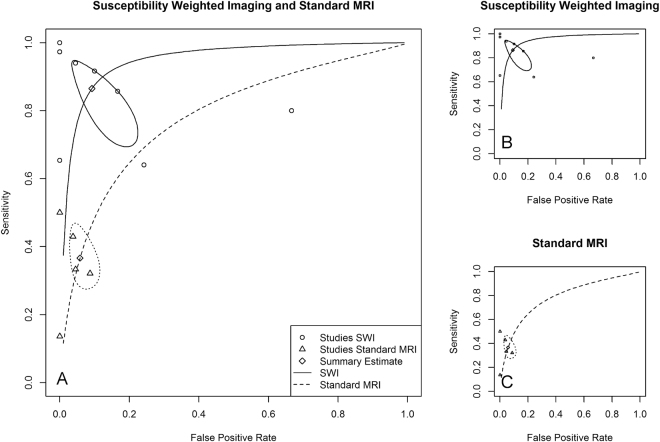
Figure 4.
Summary ROC curves of overall diagnostic accuracy for susceptibility weighted magnetic resonance imaging (SW-MRI) and magnetic resonance imaging (MRI) (A), for the overall diagnostic accuracy of SW-MRI (B) and the overall diagnostic accuracy of MRI (C). The false positive rate (1-specificity) is plotted against the false positive rate (1-specificity). The sROC curves show a deviation of the data points and especially for standard MRI, the extrapolation of the sROC curve is highly vulnerable to outliners.

