
Figure 2.
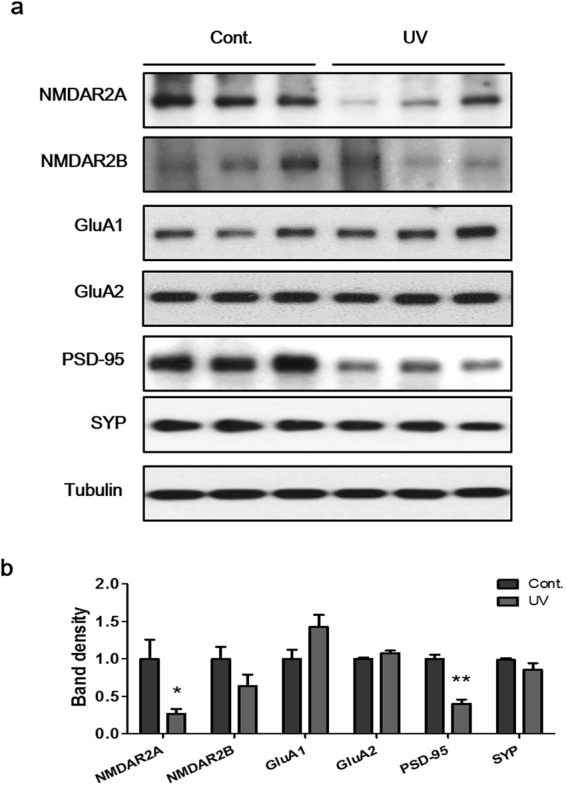
The expression levels of synaptic proteins NMDAR2A and PSD-95 were reduced by UV irradiation. (a) Representative western blot analysis results, and (b) density graphs of NMDAR2A, NMDAR2B, GluA1, GluA2, PSD-95, and SYP in the DG. Relative band density was analyzed using Image J software and normalized by tubulin. The blots are cropped raw images are provided in Supplementary Figure S3. Graphs show means ± SEM (n = 8 mice/group). *P < 0.05 and ***P < 0.001 indicate significant differences when compared to the control group. GluA1, glutamate receptor 1; GluA2, glutamate receptor 2, NMDAR2A, N-methyl-D-aspartate receptor 2 A; NMDAR2B, N-methyl-D-aspartate receptor 2B; PSD-95, post-synaptic density protein 95; SYP, synaptophysin.