
Figure 5.
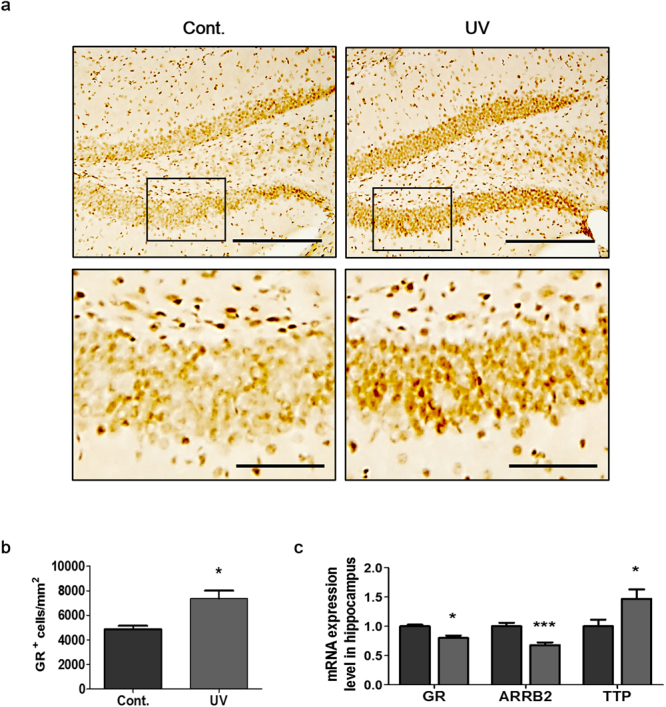
UV irradiation of mouse skin induced nuclear translocation of GR and modulated the expression levels of its target genes. (a) Representative immunohistochemical images of GR-positive cells under 200x (upper panel) and high magnification (lower panel) of insert area in the hippocampus. Scale bars: 100 µm and 50 µm, respectively. The graphs show (b) GR-positive cell numbers counted in 8 brain sections from each mouse. (c) Relative GR, ARRB2, and TTP mRNA expression levels in the hippocampus were analyzed using RT-qPCR and normalized to GAPDH expression levels. Graphs show means ± SEM (n = 8mice/group). *P < 0.05 and ***P < 0.001 indicate significant differences between groups. ARRB2, arrestin beta 2; GR, glucocorticoid receptor; TTP, tristetraproline.