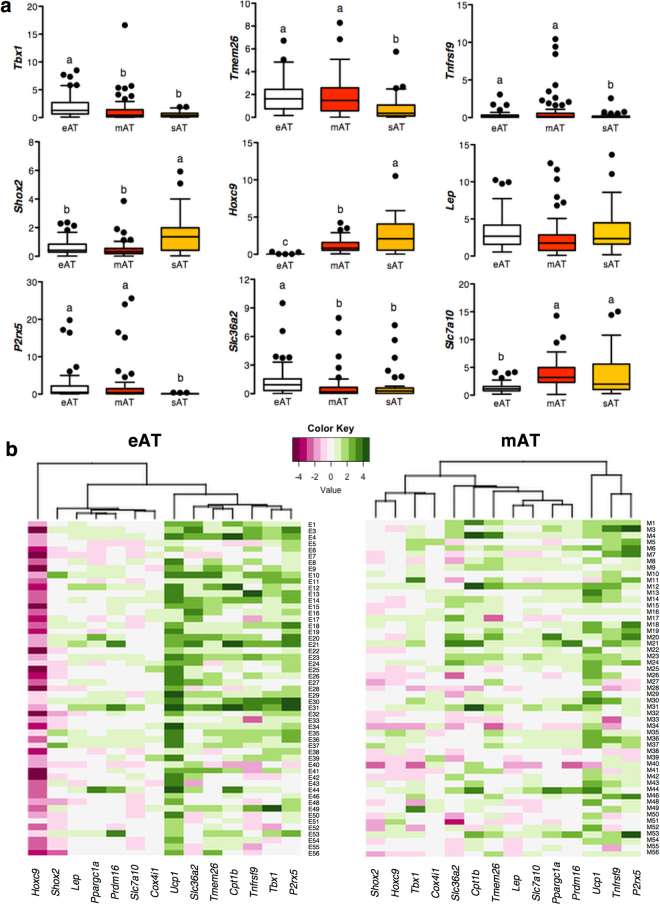
Figure 2.
Assessment of the nature of eAT, mAT and sAT depots. Expression of beige (Tmem26, Tbx1, Tnfrsf9, Slc36a2, P2rx5) and white fat (Shox2, Hoxc9, Slc7a10, Lep) markers (a) in the eAT, mAT and sAT biopsies of the main cohort (n = 53). Data are expressed as mean ± SEM. Differences were estimated using randomized block ANOVA on log-transformed data. Different alphabets represent P ≤ 0.05. Heatmaps (b) representing the cluster analysis of thermogenic-, beige- and white-fat marker genes in eAT and mAT depots when data are expressed as log-fold change relative to sAT (n = 53). Each column contains the data from a specific gene, and each row contains data from single patient. Green color represents overexpression- whereas maroon color represents lower expression- of a specific gene in eAT or mAT relative to sAT. The dendrogram shows the degree of correlation of the genes as assessed by hierarchical clustering.

