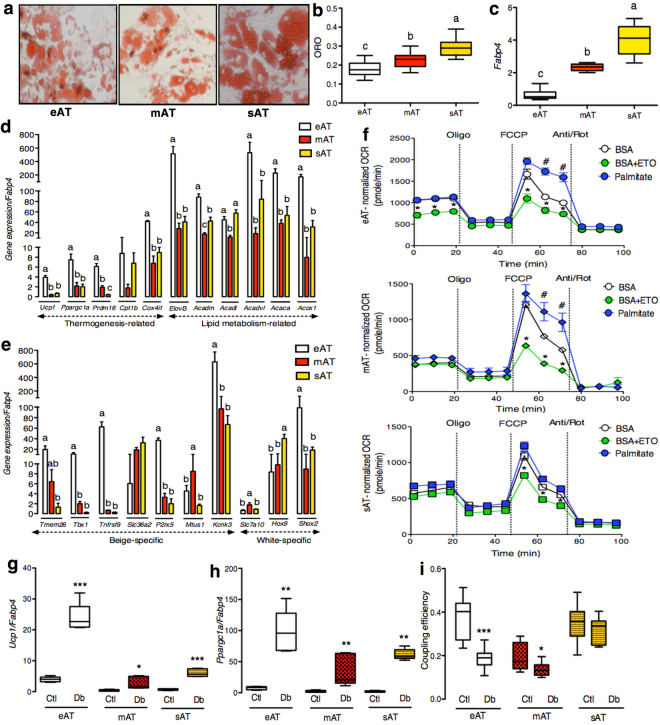
Figure 3.
In-vitro characterization of eAT-, mAT- and sAT-derived adipocytes. ORO staining (a), ORO quantification (n = 10) (b), mRNA expression of Fabp4 (n = 5) (c), thermogenesis and lipid metabolism-related gene markers (n = 5) (d) and beige-, white- fat related gene markers (n = 5) (e) in the in-vitro differentiated eAT-, mAT- and sAT- adipocytes. (f) FAO analysis using OCR assays in eAT-, mAT- and sAT- derived adipocytes (n = 5). Gene expression of Ucp1 (n = 5) (g), Ppargc1a (n = 5) (h) and coupling efficiency (n = 10) (i) of eAT-, mAT- and sAT-derived adipocytes with- or without- pretreatment with dibutyryl-cAMP (Db). The eAT-, mAT- and sAT-derived adipocytes were obtained after pooling samples from 9 patients. Data represents mean ± SEM. Significance of difference was determined by one-way ANOVA followed by Tukey’s post hoc analysis or unpaired t-tests as needed. Different alphabets represent P ≤ 0.05. *Represents P ≤ 0.05, **represents P ≤ 0.01, ***represents P ≤ 0.001. For FAO, #represents P ≤ 0.05 between palmitate and BSA and *represents P ≤ 0.05 between BSA+ETO and BSA. ORO, oil red O; FAO, fatty acid oxidation; OCR, oxygen consumption rate; BSA, bovine serum albumin; ETO, etomoxir.

