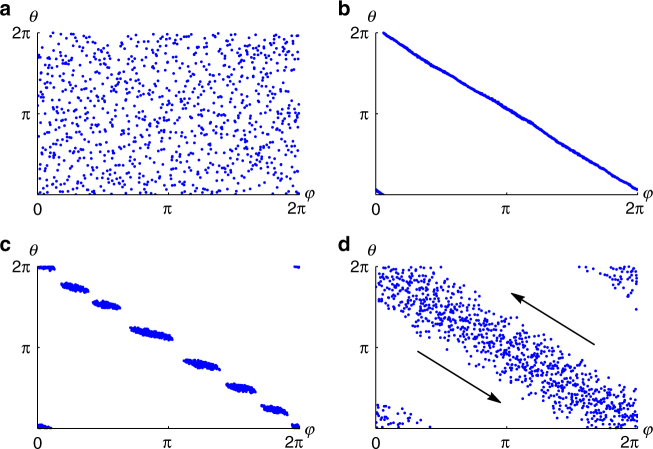
Fig. 3.
Scatter plots in (ϕ, θ) space. Distributions in (ϕ, θ) space corresponding to different states, where . Simulations were run with N = 1000 swarmalators for variable numbers of time units T and stepsize dt = 0.1. a Static async state for (J, K) = (0.1, −1) and T = 100. b Static phase wave state (J, K) = (1, 0) and T = 100. c Splintered phase wave state (J, K) = (1, −0.1) and T = 1000. d Active phase wave state (J, K) = (1.0, −0.75) and T = 1000. Black arrows indicate the shear flow motion of swarmalators. Supplementary Movies 6 and 7 correspond to panels c, d

