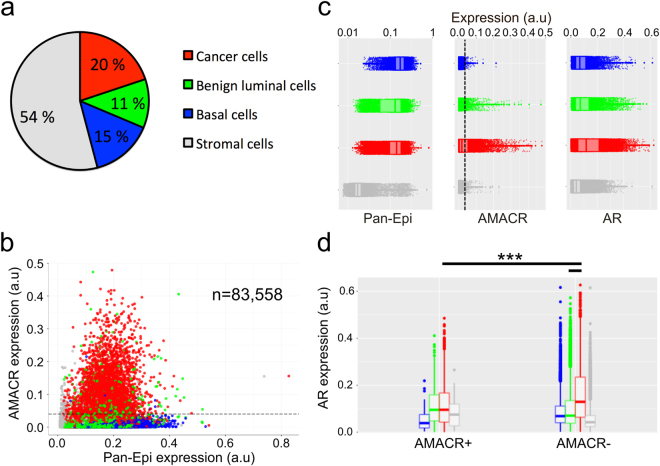
Figure 4.
Tissue cytometry of epithelial cells (patient 2) in prostate cancer. (a) Cell class distribution and (b) AMACR and Pan-Epi expression in all cells (n = 83,558) with AMACR positivity threshold indicated (dashed line). (c) Expression profile of Pan-Epi, AMACR, and AR differs between the four cell classes. (d) AR expression in AMACR− cancer cells, AMACR+ cancer cells, and in AMACR− benign luminal epithelial cells (***p < 0.001, non-parametric Kolmogorov-Smirnov test). Boxplots indicate median and quartiles. AMACR, alpha-methylacyl-CoA racemase; AR, androgen receptor; Pan-Epi, pan-epithelium.

