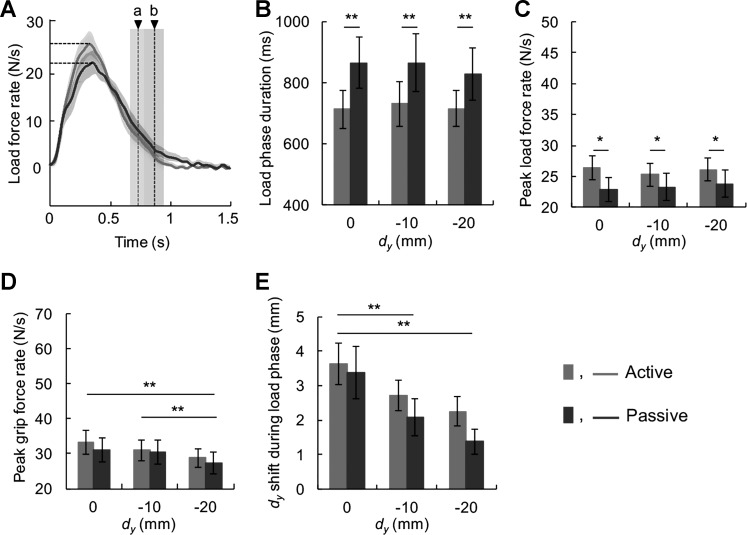
Fig. 6.
Load phase duration, load and grip force rate, and shift in digit center of pressure during the load phase of group 1. A: load force rate plotted from load force onset from a representative trial. The horizontal dashed lines denote peak load force rates, whereas the gray and black vertical dashed lines denote object lift onset for the active and passive conditions (a and b, respectively). B: average load phase duration as a function of initial vertical distance between digits center of pressure (dy). C: average peak load force rate as a function of dy. D: average peak grip force rate as a function of dy. E: shift of dy during the load phase as a function of dy. Data are mean values averaged across all subjects (vertical lines and shaded areas denote SE). *P < 0.05; **P < 0.01, statistically significant difference.

