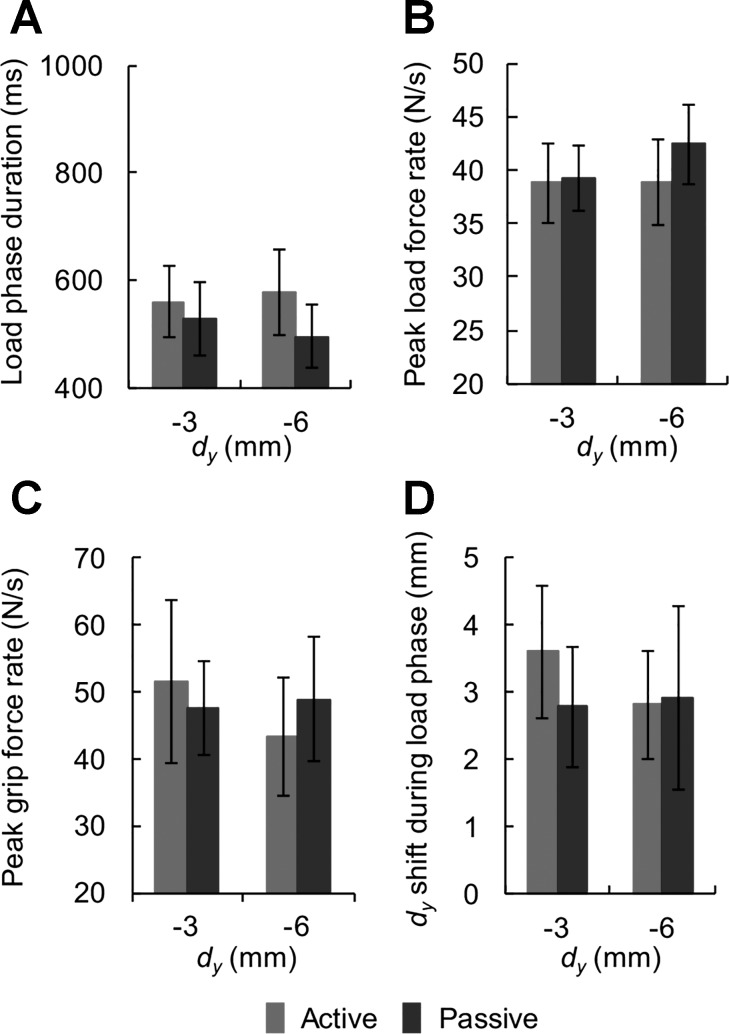
Fig. 7.
Load phase duration, load and grip force rate, and shift in digit center of pressure during the load phase of group 2. A: average load phase duration as a function of initial vertical distance between digits center of pressure (dy). B: average peak load force rate as a function of dy. C: average peak grip force rate as a function of dy. D: shift of dy during the load phase as a function of dy. Data are mean values averaged across all subjects (vertical lines and shaded areas denote SE).

