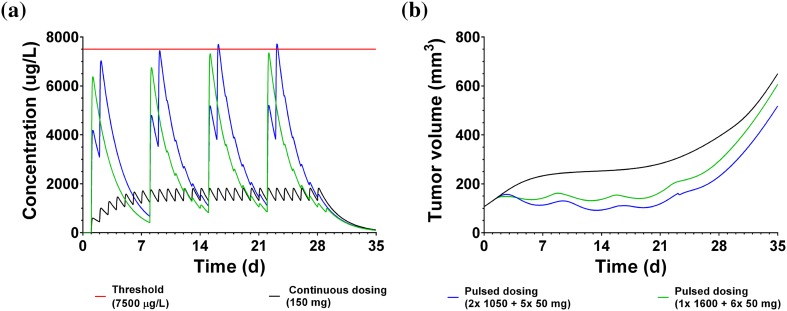
Fig. 8.
Simulation of clinical trial with erlotinib based on resistance model parameter estimation and with PK parameters of mice replaced by human parameter values. Simulation shows expected PK (a) and corresponding tumor growth behavior (b). Simulations are done for a continuous (black) and a pulsed (blue) treatment schedule. Different threshold concentrations to achieve an effect on resistant cells are simulated (red), with threshold 1 (solid red line) representing the value derived from published in previously published in vitro data and threshold 2 (dashed red line) representation more optimistic scenario. The predicted anti-tumor response is shown in (b) with continuous dose (solid black line), pulsed treatment assuming optimistic scenario (dashed blue line, threshold 2) or more pessimistic scenario (solid blue line)

