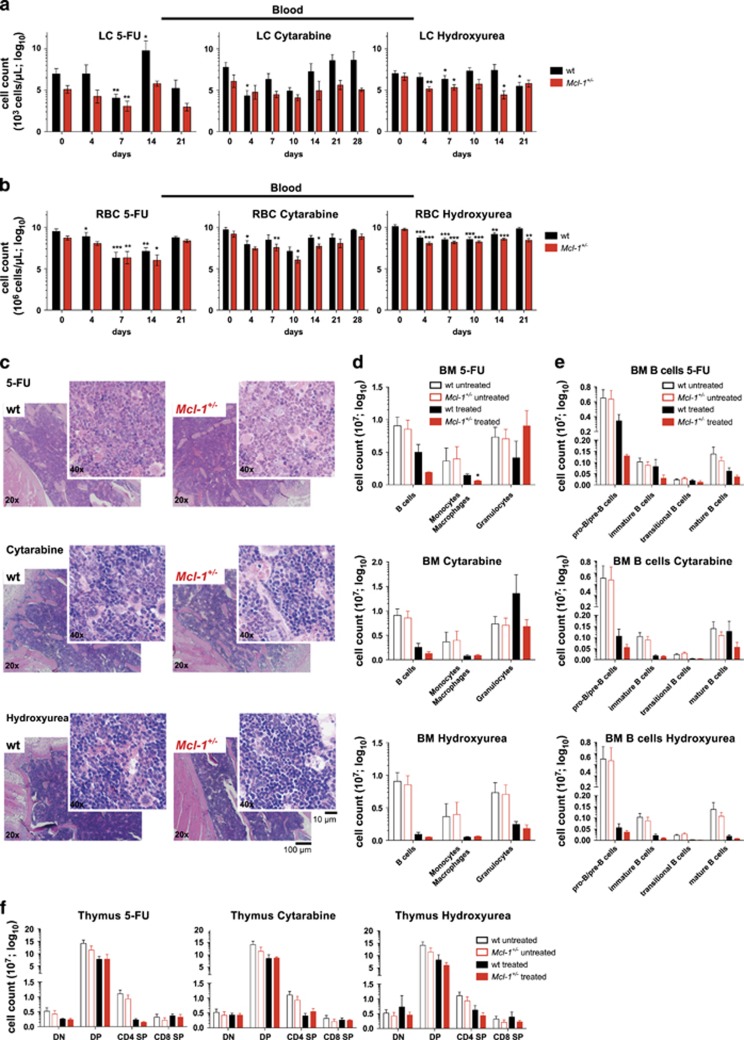
Figure 3.
Reduction in MCL-1 levels only moderately exacerbates the haematopoietic cytopenia caused by treatment with drugs that interfere with DNA synthesis. Wild-type (wt) and Mcl-1+/− mice were treated with 5-fluorouracil (1 × 5-FU; 100 mg/kg body weight, i.v.; wild-type n=8; Mcl-1+/− n=8), cytarabine (3 × 80 mg/kg body weight, i.v.; wild-type n=10; Mcl-1+/− n=9) or hydroxyurea (3 × 100 mg/kg body weight, i.p.; wild-type n=12; Mcl-1+/− n=11) and monitored for a total of 21 days (5-FU, hydroxyurea) or 28 days (cytarabine). A subset of mice of each cohort was killed 7 days post-treatment for detailed flow cytometric and histological analysis. (a) Lymphocyte (LC) and (b) RBC numbers were determined in peripheral blood at the indicated time points post-treatment with 5-FU (left panel), cytarabine (middle panel) or hydroxyurea (right panel). Data represent mean ±S.E.M. of the total numbers of the indicated cell types. *P<0.05, **P<0.01, ***P<0.001 (Student's t-test, two tailed, paired, compared with untreated). (c) Histological analysis of H&E-stained sections of the bone marrow (sternum) of wild-type and Mcl-1+/− mice 7 days post-treatment with 5-FU (upper panel), cytarabine (middle panel) or hydroxyurea (lower panel). Flow cytometric analysis of the indicated bone marrow (BM) cell populations (d) and indicated B-cell populations (e) (total cell count for one femur) in wild-type and Mcl-1+/− mice 7 days post-treatment with 5-FU (upper panel, wild-type n=3; Mcl-1+/− n=3), cytarabine (middle panel, wild-type n=6; Mcl-1+/− n=6) or hydroxyurea (lower panel, wild-type n=3; Mcl-1+/− n=3), compared with untreated wild-type (n=7) and Mcl-1+/− mice (n=7). Data represent mean ±S.E.M.. *P<0.05 (Student's t-test, two tailed, unpaired, comparing wild-type with Mcl-1+/− mice). (f) Flow cytometric analysis of total thymic T lymphoid cells in wild-type and Mcl-1+/− mice 7 days post-treatment with 5-FU (left panel, wild-type n=3; Mcl-1+/− n=3), cytarabine (middle panel, wild-type n=6; Mcl-1+/− n=6) or hydroxyurea (right panel, wild-type n=3; Mcl-1+/− n=3) compared with untreated wild-type (n=7) and Mcl-1+/−(n=7) mice. DN=double negative; DP=double positive; SP=single positive thymocytes. Data represent mean ±S.E.M. P>0.5 (n.s.) (Student's t-test, two tailed, unpaired, comparing wild-type with Mcl-1+/− mice)

