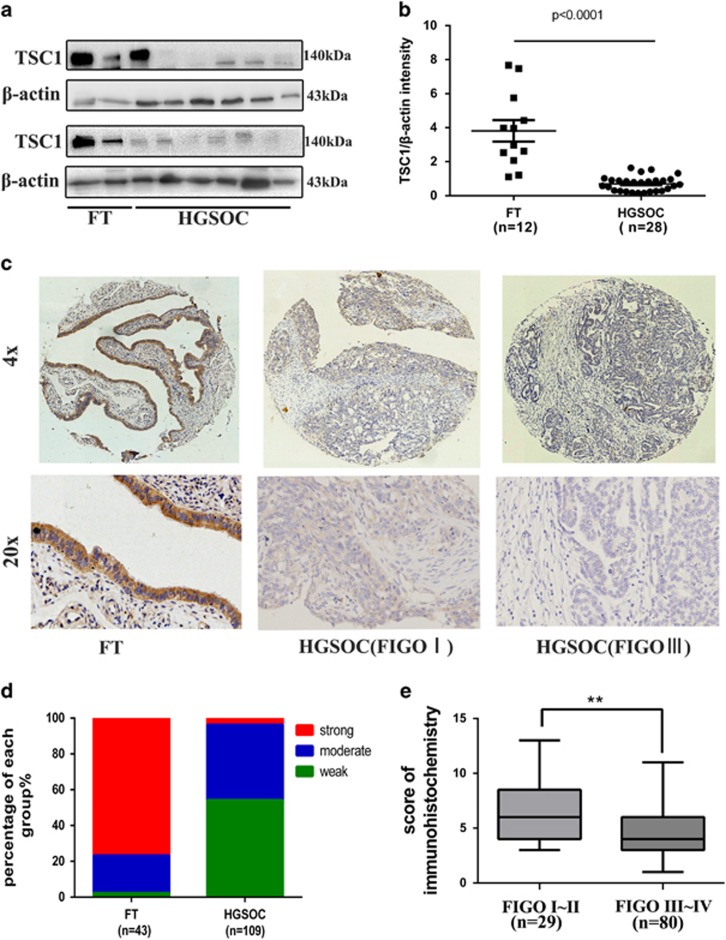
Figure 1.
Expression analysis of TSC1 in high-grade serous ovarian carcinoma. (a, b) Western blot analysis of TSC1 in HGSOC tissue samples (n=28) compared with normal fimbria (n=12). (c) Representative images of immunohistochemical staining of TSC1 in tissue microarray. (d) The expression level distribution of TSC1 (quantified by immunohistochemical score) in HGSOC compared with FT. (e) Association analysis between TSC1 expression and tumor stages. **P<0.01

