Figure 3.
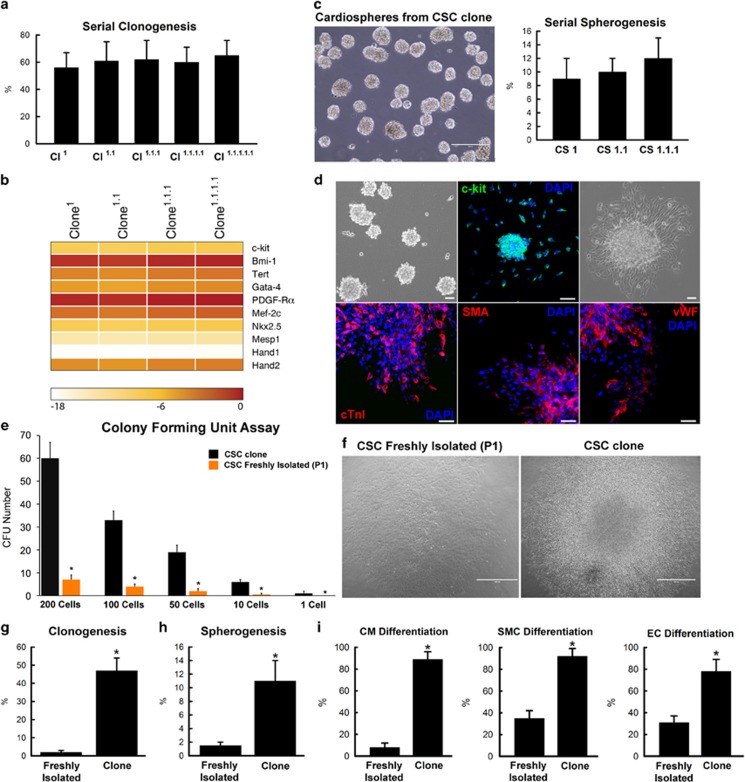
Clonogenicity and differentiation potential of clonal CD45negc-kitpos CSCs. (a) Sub-cloning efficiency of a rat c-kitpos CSC clone (Cl) at every tenth passage. Data are mean±S.D., n=6. (b) Serial sub-clones of c-kitpos CSCs, generated at P50 of the respective parental clone, maintained similar expression of multipotent and cardiac transcription factor genes. Colour scale indicates change in Ct (threshold cycle) relative to the normalised GAPDH control. Higher delta Ct values correspond to lower relative gene expression, with every Ct decrease of 3.3 representing a twofold increase in relative expression. (c) Serial spherogenesis efficiency of a clone of c-kitpos eCSCs (1, primary; 1.1, secondary; 1.1.1, tertiary CSs). Representative image of tertiary CSs are shown in the left panel, bar=50μm. (d) CSs generated from clonal c-kitpos (green) CSCs plated in basal differentiation media spontaneously commit to the CM (cTnI, red), smooth muscle (SMA, red) and endothelial (vWF, red) cell lineages. Nuclei are stained in blue by DAPI. Bar=50 μm. (e) CFU formation of cloned versus freshly isolated (at passage 1, P1) c-kitpos CSCs plated at different numbers in 1.2 ml of MethoCult medium; *P<0.05 versus cloned c-kitpos CSCs. Data are mean±S.D., n=6. (f) Representative light microscopy images of a CFU from freshly isolated (P1) c-kitpos CSCs (left panel) and cloned c-kitpos CSCs (right panel), bar=50 μm. (g and h) Clonal-derived c-kitpos CSCs show greater clonogenic (g) and CS formation (h) potential, when compared to freshly isolated (P1) c-kitpos CSCs. *P<0.05 versus freshly isolated P1. Data are mean±S.D., n=6. (i) Clonal-derived c-kitpos CSCs show greater differentiation potential into CMs (number of cTnI-positive cells), SMCs (number of SMA-positive cells) and ECs (number of vWF-positive cells), when compared to freshly isolated c-kitpos CSCs. *P<0.05 versus freshly isolated P1. Data are mean±S.D., n=6

