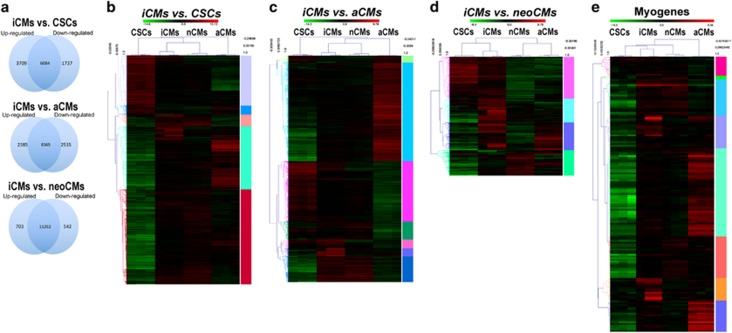
Figure 6.
c-kitpos CSC-derived CMs (iCMs) possess a genomic expression profile typical of aCMs. RNA-seq data were obtained using mRNA from cloned undifferentiated rat CSCs, beating colonies of iCMs at 21 days of the CM differentiation in vitro protocol, freshly isolated CMs from hearts of PN 1 to 2-day-old pups and from 12-week-old Wistar rats. (a) Venn diagram shows distribution of the number of common, downregulated and upregulated genes in the iCMs versus c-kitpos CSCs, iCMs versus aCMs and iCMs versus neoCMs*. (b) Heat map of RNA-seq profile of the 1737 downregulated and 3709 upregulated genes in the iCMs versus c-kitpos CSCs comparison and their GO clustering for specific gene function†. (c) Heat map of RNA-seq profile of the 2385 upregulated and 2535 downregulated genes in the iCMs versus aCMs comparison and their GO clustering for specific gene function†. (d) Heat map of RNA-seq profile of the 703 upregulated and 542 downregulated genes in the iCMs versus neoCMs comparison and their GO clustering for specific gene function†. (e) Heat map of selected myogenic gene expression (like, Tnnc1, Tnnc2, Tnnt2, Tnnt3, Tnni3, Myh18b, Myh7, Myh6, Mybpc3, Myl2, Myl3 and Actn2) from RNA-seq analysis in the c-kitpos CSC versus iCM comparison (with accompanying relative expression of the same genes in neoCMs and aCMs) and their GO clustering for specific gene function§. *Note: specific FCs for each gene in the different comparisons and the gene IDs are reported in Supplementary Table S1a. †Note: each GO clustering for specific gene function is identified by the right vertical colour band. The GO cluster names and the identification of relative included gene names is reported in Supplementary Table S1b–d, respectively. §Note: selected myogenic gene names are grouped in different GO clustering for specific gene function that are identified by the right vertical colour band. The GO cluster names and the identification of relative included gene names is reported in Supplementary Table S1e

