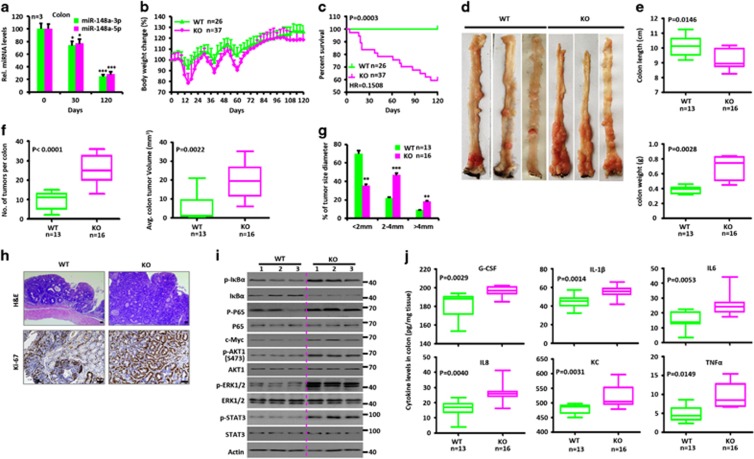
Figure 2.
miR-148a KO mice are more susceptible to AOM/dextran sodium sulfate (DSS)-induced colorectal tumorigenesis. (a) Changes of miR-148a-3p/5p expression in colon tissues collected from WT mice at days 0, 30 and 120 after AOM/DSS treatment. (a–j) WT and miR-148a KO mice were injected with AOM on day 0 and were treated with three rounds of DSS for 7 days. (b) Body weight changes of WT (n=26) and miR-148a KO (n=37) mice. (c) Survival analysis. (d) Typical images of colon tumors from WT and miR-148a KO mice 120 days after AOM/DSS treatment. (e) Colon length (Top) and weight (Bottom) were determined from WT (n=13) and miR-148a KO (n=16) mice on day 120 after AOM/DSS treatment. (f and g) Colon tumor number (f, Left), average volume (f, right) and size (g) in WT (n=13) and miR-148a KO (n=16) mice from panel (d). (h) Colon tissues collected from panel (d) were fixed, stained with hematoxylin and eosin (H&E; Top) and immuno-stained for Ki-67 (Bottom). Scale bars, 100 μm. (i) Activation of NF-κB and STAT3 signaling were determined in the colons collected from WT and miR-148a KO mice from panel (d). Each lane represents an individual mouse. (j) The levels of the indicated cytokines were determined by ELISA in colon tissues collected from WT and miR-148a KO mice from panel (d). Data present mean±S.D. in panels (a, b and g). *P<0.05, **P<0.01, ***P<0.001. Significance was determined using Wilcoxon signed-rank test in panels (e, f and j). The horizontal lines in the box plots represent the median, the boxes represent the interquartile range and the whiskers represent the minimal and maximal values

